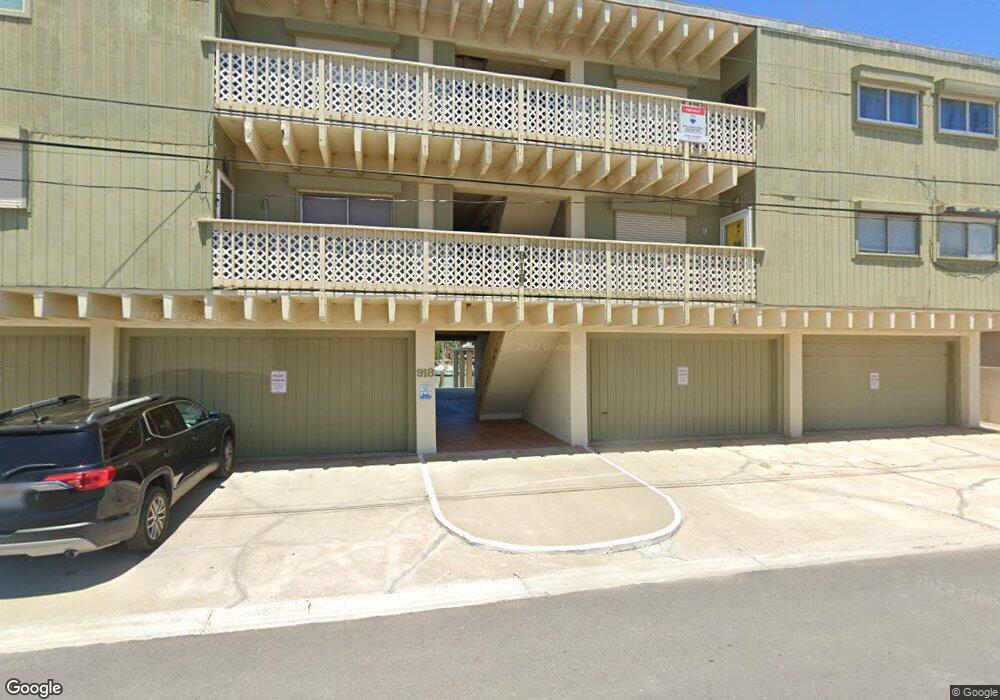
918 Tarpon Ave Unit 17 Port Isabel, TX 78578
Estimated Value: $272,000 - $371,000
3
Beds
2
Baths
1,245
Sq Ft
$251/Sq Ft
Est. Value
About This Home
This home is located at 918 Tarpon Ave Unit 17, Port Isabel, TX 78578 and is currently estimated at $312,349, approximately $250 per square foot. 918 Tarpon Ave Unit 17 is a home located in Cameron County with nearby schools including Garriga Elementary School, Derry Elementary School, and Port Isabel Junior High School.
Ownership History
Date
Name
Owned For
Owner Type
Purchase Details
Closed on
Nov 20, 2024
Sold by
Niday John Barron
Bought by
Ran Deflores Luz Cristina
Current Estimated Value
Purchase Details
Closed on
Nov 11, 2017
Sold by
Niday Patricia Ann Cone
Bought by
Niday John B
Purchase Details
Closed on
Oct 7, 2016
Sold by
Niday Patricia Ann Cone and Estate Of John Barron Niday Jr
Bought by
Niday Patricia Ann Cone
Purchase Details
Closed on
Nov 19, 2008
Sold by
Niday John B
Bought by
Niday John B
Purchase Details
Closed on
Mar 24, 2005
Sold by
Harris Jack M and Harris Mary Barbara B
Bought by
Fankhauser Delmar W and Valverde Fankhauser Dora
Home Financials for this Owner
Home Financials are based on the most recent Mortgage that was taken out on this home.
Original Mortgage
$131,100
Interest Rate
5.67%
Mortgage Type
Fannie Mae Freddie Mac
Create a Home Valuation Report for This Property
The Home Valuation Report is an in-depth analysis detailing your home's value as well as a comparison with similar homes in the area
Home Values in the Area
Average Home Value in this Area
Purchase History
| Date | Buyer | Sale Price | Title Company |
|---|---|---|---|
| Ran Deflores Luz Cristina | -- | None Listed On Document | |
| Niday John B | -- | None Available | |
| Niday Patricia Ann Cone | -- | None Available | |
| Niday John B | -- | None Available | |
| Fankhauser Delmar W | -- | -- |
Source: Public Records
Mortgage History
| Date | Status | Borrower | Loan Amount |
|---|---|---|---|
| Previous Owner | Fankhauser Delmar W | $131,100 |
Source: Public Records
Tax History Compared to Growth
Tax History
| Year | Tax Paid | Tax Assessment Tax Assessment Total Assessment is a certain percentage of the fair market value that is determined by local assessors to be the total taxable value of land and additions on the property. | Land | Improvement |
|---|---|---|---|---|
| 2025 | $2,755 | $237,804 | $67,940 | $169,864 |
| 2024 | $2,755 | $237,804 | $67,940 | $169,864 |
| 2023 | $4,943 | $227,550 | $0 | $0 |
| 2022 | $4,765 | $206,864 | $37,000 | $169,864 |
| 2021 | $4,785 | $199,554 | $29,690 | $169,864 |
| 2020 | $4,811 | $199,554 | $29,690 | $169,864 |
| 2019 | $4,741 | $199,554 | $29,690 | $169,864 |
| 2018 | $4,500 | $189,555 | $42,950 | $146,605 |
| 2017 | $2,927 | $123,580 | $42,950 | $80,630 |
| 2016 | $2,997 | $126,550 | $42,950 | $83,600 |
| 2015 | $3,127 | $129,521 | $42,950 | $86,571 |
Source: Public Records
Map
Nearby Homes
- 918 Tarpon Ave Unit 18
- 00 Tarpon Ave
- 00 Tarpon Ave Unit 19
- 1013 Tarpon Ave
- 814 Tarpon Ave Unit 28
- 813 Tarpon Ave
- 0 Pompano Ave Unit 2 103128
- 906 W Polk St Unit 27
- 917 Pompano Ave
- 909 N Shore Dr
- 1118 Pompano Ave
- 905 N Shore Dr
- 1109 Tarpon Ave
- 1113 Pompano Ave
- 813 N Shore Dr
- 1108 Bass Ave
- 1201 N Shore Dr
- Lot 23 Bass Ave
- 0 Bass Ave Unit 467130
- 0 Bass Ave Unit 38 100189
- 918 Tarpon Ave
- 918 Tarpon Ave
- 918 Tarpon Ave
- 918 Tarpon Ave
- 918 Tarpon Ave
- 918 Tarpon Ave
- 918 Tarpon Ave Unit 21
- 918 Tarpon Ave Unit 18
- 918 Tarpon Ave Unit 16
- 918 Tarpon Ave Unit 19
- 918 Tarpon Ave Unit 20
- 910 Tarpon Ave
- 922 Tarpon Ave
- 917 Tarpon Ave
- 913 Tarpon Ave
- 1000 Tarpon Ave
- 906 Tarpon Ave
- 00 Tarpon Ave Unit 1
- 905 Tarpon Ave
- 14 Tarpon Ave