91803 E Badger Rd Kennewick, WA 99338
Estimated Value: $644,000 - $757,000
4
Beds
3
Baths
2,214
Sq Ft
$315/Sq Ft
Est. Value
About This Home
This home is located at 91803 E Badger Rd, Kennewick, WA 99338 and is currently estimated at $697,434, approximately $315 per square foot. 91803 E Badger Rd is a home located in Benton County with nearby schools including Cottonwood Elementary School, Desert Hills Middle School, and Kamiakin High School.
Ownership History
Date
Name
Owned For
Owner Type
Purchase Details
Closed on
Jul 26, 2010
Sold by
Aurora Loan Services Llc
Bought by
Currey Brandon J and Ray Nicole D
Current Estimated Value
Home Financials for this Owner
Home Financials are based on the most recent Mortgage that was taken out on this home.
Original Mortgage
$266,412
Interest Rate
4.38%
Mortgage Type
FHA
Purchase Details
Closed on
Jun 9, 2010
Sold by
Curtis Dori May
Bought by
Aurora Loan Services Llc
Home Financials for this Owner
Home Financials are based on the most recent Mortgage that was taken out on this home.
Original Mortgage
$266,412
Interest Rate
4.38%
Mortgage Type
FHA
Purchase Details
Closed on
Dec 29, 2006
Sold by
Curtis Jeffery L and Curtis Jeffrey L
Bought by
Curtis Dori May
Home Financials for this Owner
Home Financials are based on the most recent Mortgage that was taken out on this home.
Original Mortgage
$270,000
Interest Rate
6.16%
Mortgage Type
Purchase Money Mortgage
Create a Home Valuation Report for This Property
The Home Valuation Report is an in-depth analysis detailing your home's value as well as a comparison with similar homes in the area
Home Values in the Area
Average Home Value in this Area
Purchase History
| Date | Buyer | Sale Price | Title Company |
|---|---|---|---|
| Currey Brandon J | $232,165 | Chicago Title | |
| Aurora Loan Services Llc | $249,000 | Chicago Title Insurance | |
| Curtis Dori May | $232,079 | Marshall Title Co |
Source: Public Records
Mortgage History
| Date | Status | Borrower | Loan Amount |
|---|---|---|---|
| Previous Owner | Currey Brandon J | $266,412 | |
| Previous Owner | Curtis Dori May | $270,000 |
Source: Public Records
Tax History Compared to Growth
Tax History
| Year | Tax Paid | Tax Assessment Tax Assessment Total Assessment is a certain percentage of the fair market value that is determined by local assessors to be the total taxable value of land and additions on the property. | Land | Improvement |
|---|---|---|---|---|
| 2024 | $5,207 | $600,630 | $322,300 | $278,330 |
| 2023 | $5,207 | $578,620 | $322,300 | $256,320 |
| 2022 | $3,505 | $332,770 | $143,130 | $189,640 |
| 2021 | $3,442 | $320,330 | $143,130 | $177,200 |
| 2020 | $3,576 | $307,900 | $143,130 | $164,770 |
| 2019 | $3,042 | $307,900 | $143,130 | $164,770 |
| 2018 | $3,689 | $269,970 | $143,130 | $126,840 |
| 2017 | $3,207 | $272,810 | $143,130 | $129,680 |
| 2016 | $3,842 | $256,940 | $86,150 | $170,790 |
| 2015 | $3,859 | $256,940 | $86,150 | $170,790 |
| 2014 | -- | $256,940 | $86,150 | $170,790 |
| 2013 | -- | $256,940 | $86,150 | $170,790 |
Source: Public Records
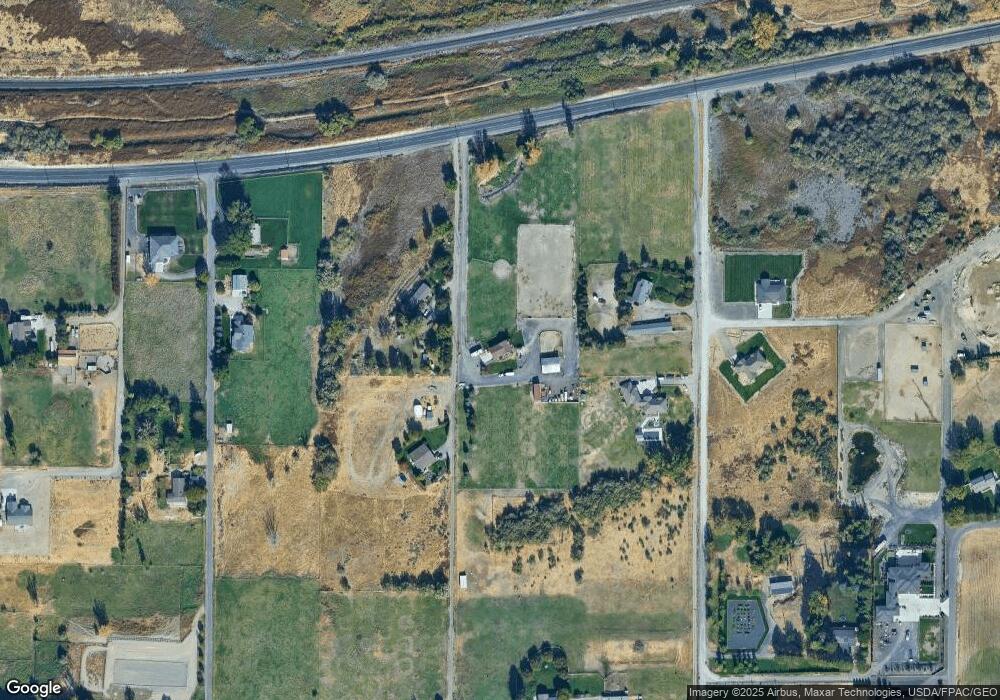
Map
Nearby Homes
- 27509 S 932 Prairie SE
- 27907 S 959 Prairie SE
- 34214 S Glenn Miller Road Prairie SE
- 22803 Cottonwood Springs Blvd
- 25911 S 1005 Prairie SE
- 26305 S 1005 Prairie SE
- 98801 E Brandon Dr
- 82385 Country Heights Dr
- 102909 E 1023 Prairie SE
- 101607 E Ridgeview Ct
- 97403 E 382 Prairie SE
- 100024 Canyon View Dr
- 6115 W 32nd Ave
- 6824 W 27th Ave
- 104105 E Badger Rd
- 78604 E Canyon Meadow Dr
- 87069 E Haven View Prairie SE
- 41213 S Clodfelter Rd
- Lot 1 S Glenn Miller Prairie SE
- 86511 E Haven View Prairie SE
- 27304 S 918 Prairie SE
- 28004 S 918 Prairie SE
- 27406 S 930 Prairie SE
- 27808 S 930 Prairie SE
- 27405 S 903 Prairie SE
- 27905 S 932 Prairie SE
- 27503 S 932 Prairie SE
- 27404 S 903 Prairie SE
- 27902 S 903 Prairie SE
- 29606 S 930 Prairie SE
- TBD S 903 Prairie SE
- 93121 E Badger Rd
- 93151 E Badger Rd
- 29351 S 932nd Prairie SE
- 29351 S 932 Prairie SE
- 93155 E Badger Rd
- 29603 S 903 Prairie SE
- 90011 E Badger Rd
- 29004 S 944 Prairie SE
- 27509 S 932 Prse