91807 E Reata Rd Unit 7500 Sq. Ft. + 40x60 Kennewick, WA 99338
Estimated Value: $964,000 - $1,223,000
4
Beds
5
Baths
4,273
Sq Ft
$263/Sq Ft
Est. Value
About This Home
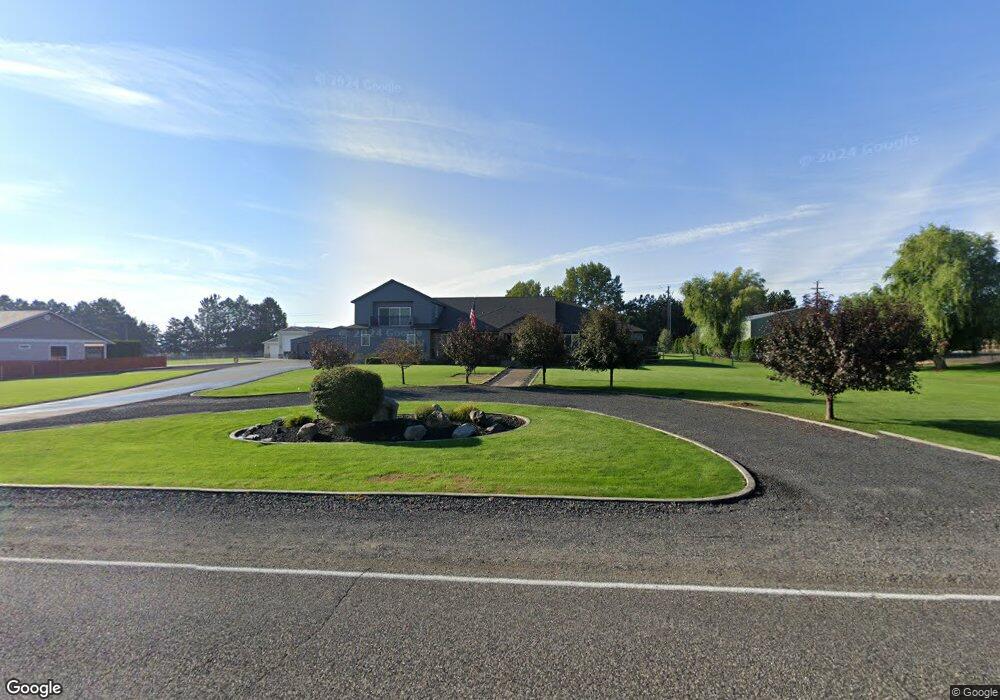
This home is located at 91807 E Reata Rd Unit 7500 Sq. Ft. + 40x60, Kennewick, WA 99338 and is currently estimated at $1,125,080, approximately $263 per square foot. 91807 E Reata Rd Unit 7500 Sq. Ft. + 40x60 is a home located in Benton County with nearby schools including Cottonwood Elementary School, Desert Hills Middle School, and Kamiakin High School.
Ownership History
Date
Name
Owned For
Owner Type
Purchase Details
Closed on
Jan 2, 2020
Sold by
Rath Sharon E and Rath Raymond J
Bought by
Rath Sharron E
Current Estimated Value
Purchase Details
Closed on
Jun 21, 2019
Sold by
James G Potter Family Trust
Bought by
Moore Wayne and Moore Kim R
Home Financials for this Owner
Home Financials are based on the most recent Mortgage that was taken out on this home.
Original Mortgage
$476,000
Outstanding Balance
$311,497
Interest Rate
4%
Mortgage Type
New Conventional
Estimated Equity
$813,583
Purchase Details
Closed on
Oct 31, 2014
Sold by
Westermeyer Steve and Westermeyer Sandy
Bought by
Potter James G and James G Potter Family Trust
Purchase Details
Closed on
Aug 25, 2006
Sold by
Nor Am Development Llc
Bought by
Westermeyer Steve and Westermeyer Sandy
Create a Home Valuation Report for This Property
The Home Valuation Report is an in-depth analysis detailing your home's value as well as a comparison with similar homes in the area
Home Values in the Area
Average Home Value in this Area
Purchase History
| Date | Buyer | Sale Price | Title Company |
|---|---|---|---|
| Rath Sharron E | -- | None Available | |
| Moore Wayne | $680,000 | First American Title Ins Co | |
| Potter James G | $472,667 | Stewart Title Co 1 | |
| Westermeyer Steve | $64,500 | Chicago Title |
Source: Public Records
Mortgage History
| Date | Status | Borrower | Loan Amount |
|---|---|---|---|
| Open | Moore Wayne | $476,000 |
Source: Public Records
Tax History Compared to Growth
Tax History
| Year | Tax Paid | Tax Assessment Tax Assessment Total Assessment is a certain percentage of the fair market value that is determined by local assessors to be the total taxable value of land and additions on the property. | Land | Improvement |
|---|---|---|---|---|
| 2024 | $10,609 | $1,074,060 | $212,670 | $861,390 |
| 2023 | $10,609 | $1,185,550 | $212,670 | $972,880 |
| 2022 | $7,378 | $735,300 | $98,190 | $637,110 |
| 2021 | $7,754 | $679,090 | $98,190 | $580,900 |
| 2020 | $7,808 | $698,630 | $98,190 | $600,440 |
| 2019 | $6,819 | $676,400 | $98,190 | $578,210 |
| 2018 | $7,600 | $609,680 | $98,190 | $511,490 |
| 2017 | $6,667 | $565,200 | $98,190 | $467,010 |
| 2016 | $6,759 | $534,960 | $62,830 | $472,130 |
| 2015 | $7,972 | $534,960 | $62,830 | $472,130 |
| 2014 | -- | $625,150 | $68,400 | $556,750 |
| 2013 | -- | $625,150 | $68,400 | $556,750 |
Source: Public Records
Map
Nearby Homes
- 3682 Morningside Pkwy
- 3721 Morningside Pkwy
- 3735 Morningside Pkwy
- 3791 Morningside Pkwy
- 3646 Morningside Pkwy
- 10414 S 952 Prairie SE
- 87626 E Calico Rd
- 2842 Sumac Ave
- 3725 Nuthatch St
- NKA Bermuda Rd
- 3629 Allison Way Lot 172
- 2922 Savanna Ave Lot 278
- NKA Whitesage Ave Lot 273
- 3425 Nuthatch Street Lot 261
- 3378 Allison Way Lot 256
- 3000 Meadowlark Ave Lot 246
- 2992 Meadowlark Ave Lot 245
- 2904 Meadowlark Ave Lot 234
- 2937 Whitesage Avenue Lot 272
- 2961 Whitesage Avenue Lot 270
- 91807 E Reata Rd
- 91807 E Reata Rd
- 91905 E Reata Rd
- 91209 E Reata Rd
- 6814 Ryanick Rd
- 92205 E Reata Rd
- 91506 E 83 Prairie SE
- 6612 Ryanick Rd Unit Stucco Rambler with
- 6612 Ryanick Rd Unit Beautiful El Rancho
- 6612 Ryanick Rd
- 92605 E Reata Rd
- 91804 E 83 Prairie SE
- 6711 Ryanick Rd
- 91102 Badger View Rd
- 91102 Badger View Rd
- 91102 E Badger Rd
- 92204 E 83 Prairie SE
- 6509 Ryanick Rd
- 6310 Ryanick Rd
- 91102 Badger View Dr