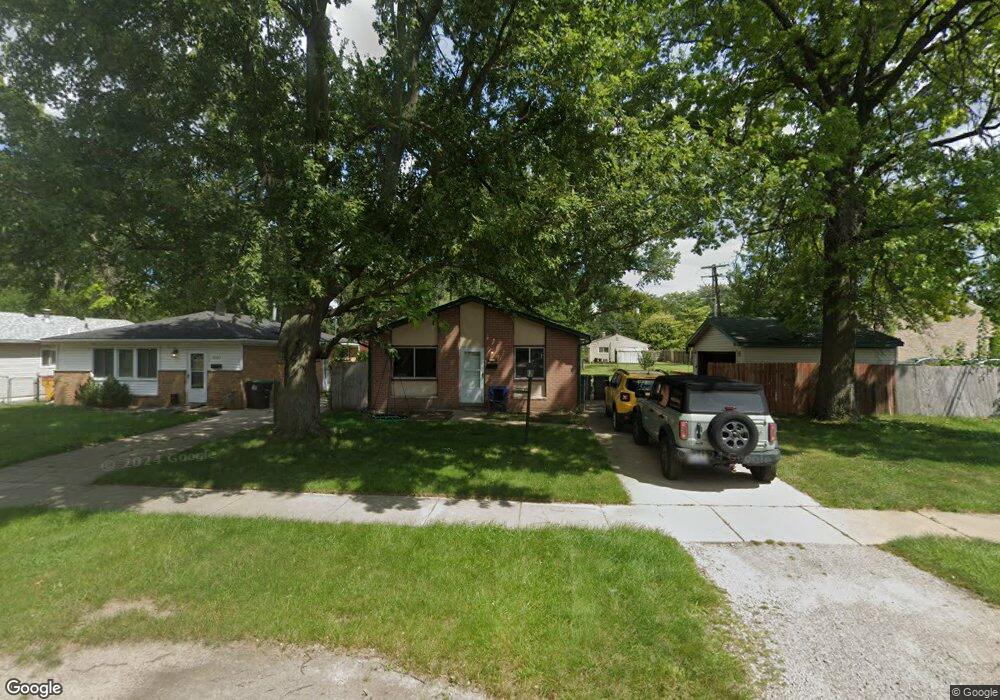
9181 Groschner St Taylor, MI 48180
Estimated Value: $139,835 - $182,000
Studio
1
Bath
1,001
Sq Ft
$165/Sq Ft
Est. Value
About This Home
This home is located at 9181 Groschner St, Taylor, MI 48180 and is currently estimated at $164,959, approximately $164 per square foot. 9181 Groschner St is a home located in Wayne County with nearby schools including Clarence Randall Elementary School, Robert J. West Middle School, and Taylor High School.
Ownership History
Date
Name
Owned For
Owner Type
Purchase Details
Closed on
Mar 8, 2024
Sold by
Bibik Alexandra Katherine
Bought by
Trotter David L and Dranberg Chelsea E
Current Estimated Value
Home Financials for this Owner
Home Financials are based on the most recent Mortgage that was taken out on this home.
Original Mortgage
$117,826
Outstanding Balance
$114,943
Interest Rate
6.69%
Mortgage Type
FHA
Estimated Equity
$50,016
Purchase Details
Closed on
Aug 5, 2021
Sold by
Price Michele and Price Michelle
Bought by
Borkowski Alexandra Katherine
Home Financials for this Owner
Home Financials are based on the most recent Mortgage that was taken out on this home.
Original Mortgage
$68,732
Interest Rate
2.9%
Mortgage Type
FHA
Purchase Details
Closed on
Sep 17, 2009
Sold by
Borkowski Steven J
Bought by
Price Michele
Purchase Details
Closed on
May 29, 1998
Sold by
Black Janie and Burk Janie
Bought by
Price Michele
Create a Home Valuation Report for This Property
The Home Valuation Report is an in-depth analysis detailing your home's value as well as a comparison with similar homes in the area
Home Values in the Area
Average Home Value in this Area
Purchase History
| Date | Buyer | Sale Price | Title Company |
|---|---|---|---|
| Trotter David L | $120,000 | None Listed On Document | |
| Trotter David L | $120,000 | None Listed On Document | |
| Borkowski Alexandra Katherine | $70,000 | Amrock Llc | |
| Price Michele | -- | None Available | |
| Price Michele | $28,000 | -- |
Source: Public Records
Mortgage History
| Date | Status | Borrower | Loan Amount |
|---|---|---|---|
| Open | Trotter David L | $117,826 | |
| Closed | Trotter David L | $117,826 | |
| Previous Owner | Borkowski Alexandra Katherine | $68,732 |
Source: Public Records
Tax History
| Year | Tax Paid | Tax Assessment Tax Assessment Total Assessment is a certain percentage of the fair market value that is determined by local assessors to be the total taxable value of land and additions on the property. | Land | Improvement |
|---|---|---|---|---|
| 2025 | $3,150 | $72,500 | $0 | $0 |
| 2024 | $2,434 | $62,600 | $0 | $0 |
| 2023 | $2,876 | $56,400 | $0 | $0 |
| 2022 | $2,323 | $50,900 | $0 | $0 |
| 2021 | $2,017 | $46,400 | $0 | $0 |
| 2020 | $1,995 | $39,200 | $0 | $0 |
| 2019 | $198,599 | $40,200 | $0 | $0 |
| 2018 | $1,672 | $30,400 | $0 | $0 |
| 2017 | $603 | $30,900 | $0 | $0 |
| 2016 | $1,431 | $30,000 | $0 | $0 |
| 2015 | $2,652 | $27,500 | $0 | $0 |
| 2013 | $2,640 | $27,500 | $0 | $0 |
| 2012 | $1,172 | $26,700 | $6,400 | $20,300 |
Source: Public Records
Map
Nearby Homes
- 22327 Wick Rd
- 22311 Wick Rd
- 22726 Haskell St
- 8935 Lincoln St
- 9560 Sylvester St
- 22185 Wick Rd
- 22134 Wick Rd
- 23319 Haig St
- 9651 Blaty St
- 22137 Haskell St
- 9223 Roosevelt St
- 9255 Syracuse St
- 9360 Pine St
- 8279 Elm St
- 9814 Cass Ave
- 22931 Champaign St
- 22150 Haig St
- 23665 Haig St
- 0000 Wick Rd
- 8245 Roosevelt St
- 9167 Groschner St
- 9151 Groschner St
- 9137 Groschner St
- 22950 Wick Rd
- 9123 Groschner St
- 9180 Groschner St
- 9164 Groschner St
- 9164 Trafalgar St
- 9188 Groschner St
- 9188 Trafalgar St
- 9150 Groschner St
- 23006 Wick Rd
- 9150 Trafalgar St
- 9109 Groschner St
- 9136 Trafalgar St
- 23014 Wick Rd
- 9122 Trafalgar St
- 9043 Groschner St
- 23022 Wick Rd
- 9108 Groschner St
Your Personal Tour Guide
Ask me questions while you tour the home.