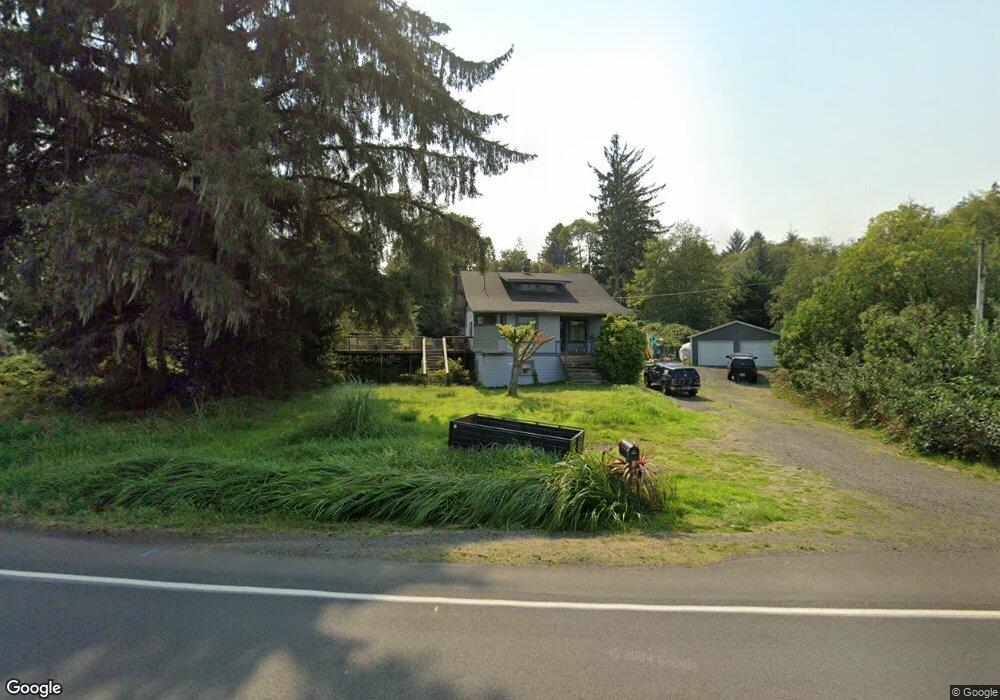
91810 Youngs River Rd Astoria, OR 97103
Estimated Value: $459,000 - $655,000
6
Beds
2
Baths
2,054
Sq Ft
$254/Sq Ft
Est. Value
About This Home
This home is located at 91810 Youngs River Rd, Astoria, OR 97103 and is currently estimated at $522,219, approximately $254 per square foot. 91810 Youngs River Rd is a home located in Clatsop County with nearby schools including Lewis & Clark Elementary School, Astor Elementary School, and Astoria Middle School.
Ownership History
Date
Name
Owned For
Owner Type
Purchase Details
Closed on
Dec 15, 2015
Sold by
Fannie Mae
Bought by
Christensen Neil
Current Estimated Value
Purchase Details
Closed on
Jun 30, 2015
Sold by
Aiken Stephen R and Aiken Suzanne M
Bought by
Wells Fargo Bank Na
Purchase Details
Closed on
May 1, 2015
Sold by
Wells Fargo Bank Na
Bought by
Federal National Mortgage Association and Fnma
Purchase Details
Closed on
May 31, 2007
Sold by
Killion William F and Killion Genevieve E
Bought by
Aiken Stephen Ray and Aiken Suzanne Marie
Home Financials for this Owner
Home Financials are based on the most recent Mortgage that was taken out on this home.
Original Mortgage
$210,700
Interest Rate
6.12%
Mortgage Type
Unknown
Purchase Details
Closed on
Jun 15, 1999
Sold by
Killion William F and Killion Genevieve E
Bought by
Aiken Stephen Ray and Aiken Suzanne Marie
Create a Home Valuation Report for This Property
The Home Valuation Report is an in-depth analysis detailing your home's value as well as a comparison with similar homes in the area
Home Values in the Area
Average Home Value in this Area
Purchase History
| Date | Buyer | Sale Price | Title Company |
|---|---|---|---|
| Christensen Neil | $70,000 | Ticor Title | |
| Wells Fargo Bank Na | $308,652 | None Available | |
| Federal National Mortgage Association | -- | None Available | |
| Aiken Stephen Ray | -- | Fidelity | |
| Aiken Stephen Ray | $100,000 | Ticor Title Insurance |
Source: Public Records
Mortgage History
| Date | Status | Borrower | Loan Amount |
|---|---|---|---|
| Previous Owner | Aiken Stephen Ray | $210,700 |
Source: Public Records
Tax History Compared to Growth
Tax History
| Year | Tax Paid | Tax Assessment Tax Assessment Total Assessment is a certain percentage of the fair market value that is determined by local assessors to be the total taxable value of land and additions on the property. | Land | Improvement |
|---|---|---|---|---|
| 2025 | $3,334 | $213,230 | -- | -- |
| 2024 | $3,232 | $207,021 | -- | -- |
| 2023 | $3,122 | $200,992 | $0 | $0 |
| 2022 | $2,989 | $195,138 | $0 | $0 |
| 2021 | $2,910 | $189,456 | $0 | $0 |
| 2020 | $2,830 | $183,939 | $0 | $0 |
| 2019 | $2,748 | $178,582 | $0 | $0 |
| 2018 | $2,493 | $173,381 | $0 | $0 |
| 2017 | $2,355 | $168,332 | $0 | $0 |
| 2016 | $2,176 | $163,430 | $60,779 | $102,651 |
| 2015 | $2,094 | $158,671 | $59,009 | $99,662 |
| 2014 | $2,060 | $154,051 | $0 | $0 |
| 2013 | -- | $149,565 | $0 | $0 |
Source: Public Records
Map
Nearby Homes
- 35579 Bella Ridge Loop
- Lot 36 Bella Ridge Loop
- 16 Bella Ridge Loop
- 92187 Lewis & Clark Rd
- 92187 Lewis And Clark Rd
- 0 H St Unit 25-990
- 0 V L Adj To 91906 Lewis and Rd Unit 25-687
- 91906 Lewis And Clark Rd
- 91755 Lewis And Clark Rd
- 91755 Lewis & Clark Rd
- 0 Wireless Rd
- 0 S Schwab St
- 0 S Schwab St Unit 24-310
- 36655 King Kong Ln
- 35134 Helligso Ln
- 36629 King Kong Ln
- 35111 Helligso Ln
- 0 Clover Rd
- 2041 SE 1st St
- 0 Adj To 2314 Se 1st
- 35881 Dow Ln
- 91772 Youngs River Rd
- 91850 Youngs River Rd
- 91760 Youngs River Rd
- 91742 Youngs River Rd
- 91826 Youngs River Rd
- 35852 Dow Ln
- 91740 Youngs River Rd
- 35830 Dow Ln
- 91729 Youngs River Rd
- 91729 Youngs River Rd
- 91728 Youngs River Rd
- 91870 Youngs River Rd
- 91868 Youngs River Rd
- 35798 Dow Ln
- 91707 Youngs River Rd
- 91714 Youngs River Rd
- 91702 Youngs River Rd
- 35796 Lindberg Ln
- 35780 Dow Ln