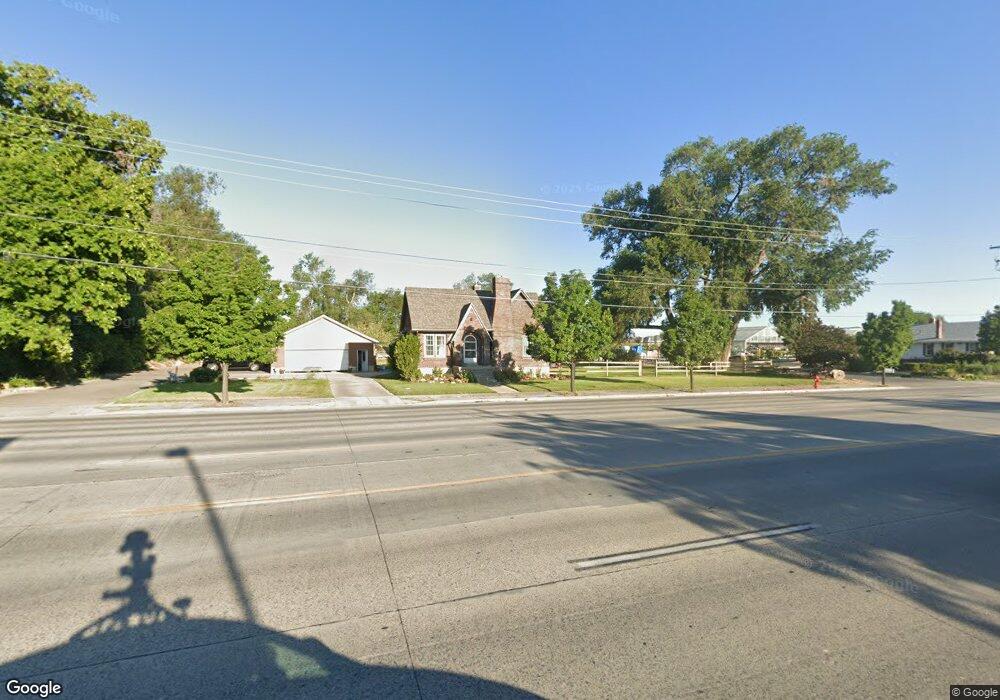
9184 S Redwood Rd West Jordan, UT 84088
Estimated Value: $530,000 - $728,000
3
Beds
3
Baths
1,376
Sq Ft
$446/Sq Ft
Est. Value
About This Home
This home is located at 9184 S Redwood Rd, West Jordan, UT 84088 and is currently estimated at $613,426, approximately $445 per square foot. 9184 S Redwood Rd is a home located in Salt Lake County with nearby schools including Westvale Elementary School, West Jordan Middle School, and West Jordan High School.
Ownership History
Date
Name
Owned For
Owner Type
Purchase Details
Closed on
Dec 10, 2021
Sold by
Talkau 9184 Llc
Bought by
Schmidt Ryan R and Schmidt Anna Caroline
Current Estimated Value
Home Financials for this Owner
Home Financials are based on the most recent Mortgage that was taken out on this home.
Original Mortgage
$320,000
Outstanding Balance
$294,434
Interest Rate
3.14%
Mortgage Type
New Conventional
Estimated Equity
$318,992
Purchase Details
Closed on
Jan 29, 2008
Sold by
Baird Robert Dean and Baird Virginia Schmidt
Bought by
Roviba Properties Llc
Purchase Details
Closed on
Jan 27, 2008
Sold by
Baird Robert D and Baird Virginia S
Bought by
Roviba Properties Llc
Purchase Details
Closed on
Aug 15, 2005
Sold by
Talkau Family Lp
Bought by
Rock Fish Lc
Home Financials for this Owner
Home Financials are based on the most recent Mortgage that was taken out on this home.
Original Mortgage
$1,500,000
Interest Rate
10%
Mortgage Type
Unknown
Create a Home Valuation Report for This Property
The Home Valuation Report is an in-depth analysis detailing your home's value as well as a comparison with similar homes in the area
Home Values in the Area
Average Home Value in this Area
Purchase History
| Date | Buyer | Sale Price | Title Company |
|---|---|---|---|
| Schmidt Ryan R | -- | Cottonwood Ttl Ins Agcy Inc | |
| Roviba Properties Llc | -- | Cottonwood Title | |
| Roviba Properties Llc | -- | Cottonwood Title | |
| Rock Fish Lc | -- | Merrill Title |
Source: Public Records
Mortgage History
| Date | Status | Borrower | Loan Amount |
|---|---|---|---|
| Open | Schmidt Ryan R | $320,000 | |
| Previous Owner | Rock Fish Lc | $1,500,000 |
Source: Public Records
Tax History Compared to Growth
Tax History
| Year | Tax Paid | Tax Assessment Tax Assessment Total Assessment is a certain percentage of the fair market value that is determined by local assessors to be the total taxable value of land and additions on the property. | Land | Improvement |
|---|---|---|---|---|
| 2025 | $2,680 | $546,400 | $290,900 | $255,500 |
| 2024 | $2,680 | $515,700 | $277,100 | $238,600 |
| 2023 | $2,411 | $437,200 | $256,500 | $180,700 |
| 2022 | $2,570 | $458,400 | $251,500 | $206,900 |
| 2021 | $2,284 | $370,900 | $201,200 | $169,700 |
| 2020 | $2,292 | $349,300 | $201,200 | $148,100 |
| 2019 | $2,269 | $339,100 | $201,200 | $137,900 |
| 2018 | $2,054 | $304,500 | $195,900 | $108,600 |
| 2017 | $2,027 | $299,200 | $195,900 | $103,300 |
| 2016 | $1,650 | $228,800 | $195,900 | $32,900 |
| 2015 | $1,914 | $258,700 | $195,900 | $62,800 |
| 2014 | $1,831 | $243,700 | $186,500 | $57,200 |
Source: Public Records
Map
Nearby Homes
- 1968 W 9270 S Unit C
- 1753 Rylie Ann Cir
- 9252 S 2040 W Unit D
- 9511 S Tirado Cove Unit 204
- Brook Haven Plan at Jordan Woods
- Maple Plan at Jordan Woods
- The Maple Basement Plan at Jordan Woods
- The Evergreen Basement Plan at Jordan Woods
- 9503 S Tirado Cove Unit 203
- 1673 Peaceful Cir
- 9414 S 1980 W
- 1719 W Brocious Way Unit 301
- 2116 W Abbey View Rd
- 9496 S 1930 W
- 2097 Jordan Villa Dr
- 2177 W 9240 S
- 2223 W Williamsburg Cir
- 9141 S Little Creek Dr
- 9635 S 1600 W
- 1741 W Nikos Ln
- 9190 S Redwood Rd
- 9222 Redwood Rd
- 9222 S Redwood Rd
- 9155 S Redwood Rd
- 9149 S Redwood Rd
- 9120 S Redwood Rd
- 1793 W Bandana Cir Unit A
- 1793 W Bandana Cir Unit D
- 1650 W Fox Park Dr
- 1650 W Fox Park Dr Unit DR
- 9118 S Redwood Rd
- 9224 S Redwood Rd
- 9221 S Redwood Rd
- 1843 W Bandana Cir Unit C
- 1843 W Bandana Cir Unit D
- 9300 S Redwood Rd
- 1852 W 9170 S Unit C
- 1852 W 9170 S Unit D
- 1851 W 9170 S Unit A
- 1851 W 9170 S Unit D