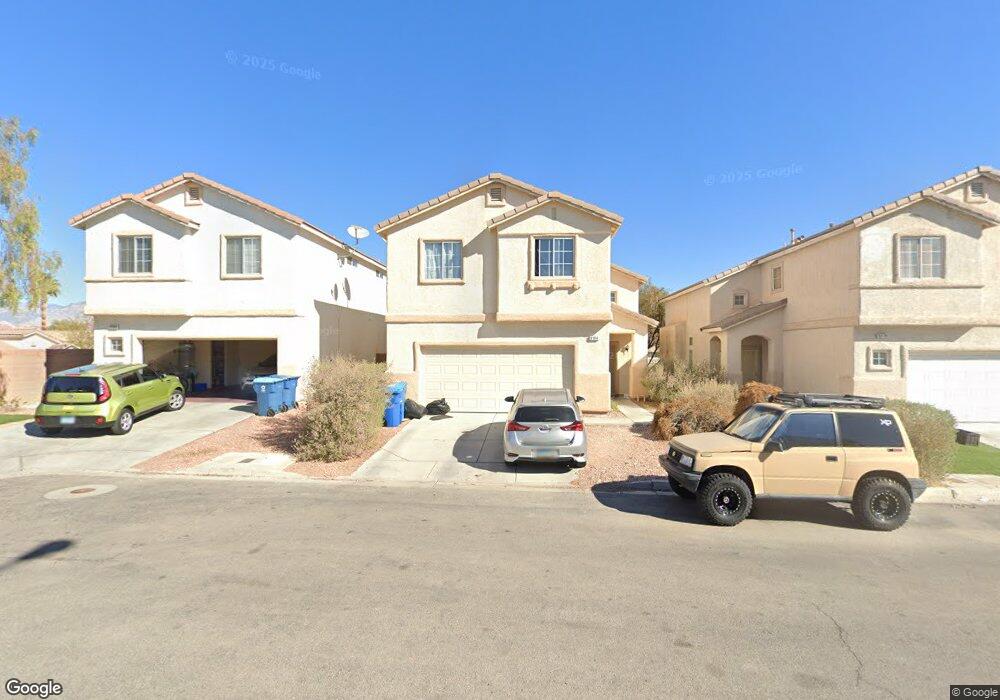
9184 Whitecap Rains Ct Unit 2 Las Vegas, NV 89148
Estimated Value: $418,272 - $479,000
3
Beds
3
Baths
1,609
Sq Ft
$278/Sq Ft
Est. Value
About This Home
This home is located at 9184 Whitecap Rains Ct Unit 2, Las Vegas, NV 89148 and is currently estimated at $446,818, approximately $277 per square foot. 9184 Whitecap Rains Ct Unit 2 is a home located in Clark County with nearby schools including Wayne N. Tanaka Elementary School, Wilbur & Theresa Faiss Middle School, and Sierra Vista High School.
Ownership History
Date
Name
Owned For
Owner Type
Purchase Details
Closed on
Oct 24, 2011
Sold by
U S Bank National Association
Bought by
Xu Weimin
Current Estimated Value
Purchase Details
Closed on
May 22, 2011
Sold by
Hook Jacob D
Bought by
Bank Of America National Association
Purchase Details
Closed on
Aug 17, 2004
Sold by
Hook Jacob Daniel
Bought by
Hook Jacob D
Home Financials for this Owner
Home Financials are based on the most recent Mortgage that was taken out on this home.
Original Mortgage
$211,400
Interest Rate
5.97%
Mortgage Type
New Conventional
Purchase Details
Closed on
Nov 4, 2003
Sold by
Oquendo Llc
Bought by
Hook Jacob Daniel
Home Financials for this Owner
Home Financials are based on the most recent Mortgage that was taken out on this home.
Original Mortgage
$139,040
Interest Rate
6.65%
Mortgage Type
Unknown
Create a Home Valuation Report for This Property
The Home Valuation Report is an in-depth analysis detailing your home's value as well as a comparison with similar homes in the area
Home Values in the Area
Average Home Value in this Area
Purchase History
| Date | Buyer | Sale Price | Title Company |
|---|---|---|---|
| Xu Weimin | $120,000 | Ticor Title Las Vegas | |
| Bank Of America National Association | $104,800 | Accommodation | |
| Hook Jacob D | -- | Ticor Title Of Nevada Inc | |
| Hook Jacob Daniel | $173,800 | United Title Of Nevada |
Source: Public Records
Mortgage History
| Date | Status | Borrower | Loan Amount |
|---|---|---|---|
| Previous Owner | Hook Jacob D | $211,400 | |
| Previous Owner | Hook Jacob Daniel | $139,040 | |
| Closed | Hook Jacob Daniel | $34,760 |
Source: Public Records
Tax History Compared to Growth
Tax History
| Year | Tax Paid | Tax Assessment Tax Assessment Total Assessment is a certain percentage of the fair market value that is determined by local assessors to be the total taxable value of land and additions on the property. | Land | Improvement |
|---|---|---|---|---|
| 2025 | $2,174 | $105,014 | $38,500 | $66,514 |
| 2024 | $2,014 | $105,014 | $38,500 | $66,514 |
| 2023 | $2,014 | $96,114 | $33,250 | $62,864 |
| 2022 | $1,865 | $85,344 | $28,000 | $57,344 |
| 2021 | $2,251 | $78,997 | $24,500 | $54,497 |
| 2020 | $1,601 | $79,203 | $25,200 | $54,003 |
| 2019 | $1,500 | $72,265 | $19,250 | $53,015 |
| 2018 | $1,431 | $68,960 | $18,200 | $50,760 |
| 2017 | $1,989 | $67,810 | $16,450 | $51,360 |
| 2016 | $1,593 | $59,361 | $11,900 | $47,461 |
| 2015 | $1,589 | $50,894 | $10,850 | $40,044 |
| 2014 | $1,548 | $42,861 | $7,000 | $35,861 |
Source: Public Records
Map
Nearby Homes
- 9186 Berstler Ave Unit 1A
- 6788 Rose Mallow St Unit 3
- 6768 Pastel Camellia St
- 9219 Broome Ct
- 6884 Stonetrace St
- 9330 W Maule Ave Unit 226
- 9330 W Maule Ave Unit 212
- 9163 Vesey Ave
- 9086 Nostrand Ave
- 6670 Tumoulin St
- 6646 Tumoulin St
- 9137 Rivington Ave
- 9125 Rivington Ave
- 9113 Rivington Ave
- 9178 Rivington Ave
- 9190 Rivington Ave
- 9142 Rivington Ave
- 9184 Rivington Ave
- Plan 1590 at Upton
- Plan 2124 at Upton
- 9174 Whitecap Rains Ct Unit 2
- 9194 Whitecap Rains Ct
- 9164 Whitecap Rains Ct
- 9183 Regal Morning Ct Unit 522
- 9193 Regal Morning Ct
- 9163 Regal Morning Ct
- 9163 Regal Morning Ct Unit none
- 9185 Whitecap Rains Ct
- 9195 Whitecap Rains Ct
- 9175 Whitecap Rains Ct
- 9175 Whitecap Rains Ct Unit none
- 9165 Whitecap Rains Ct
- 6775 Quarterhorse Ln
- 6783 Quarterhorse Ln
- 6767 Quarterhorse Ln
- 6767 Quarterhorse Ln Unit n/a
- 6791 Quarterhorse Ln
- 6780 Autumn Morning St
- 6759 Quarterhorse Ln