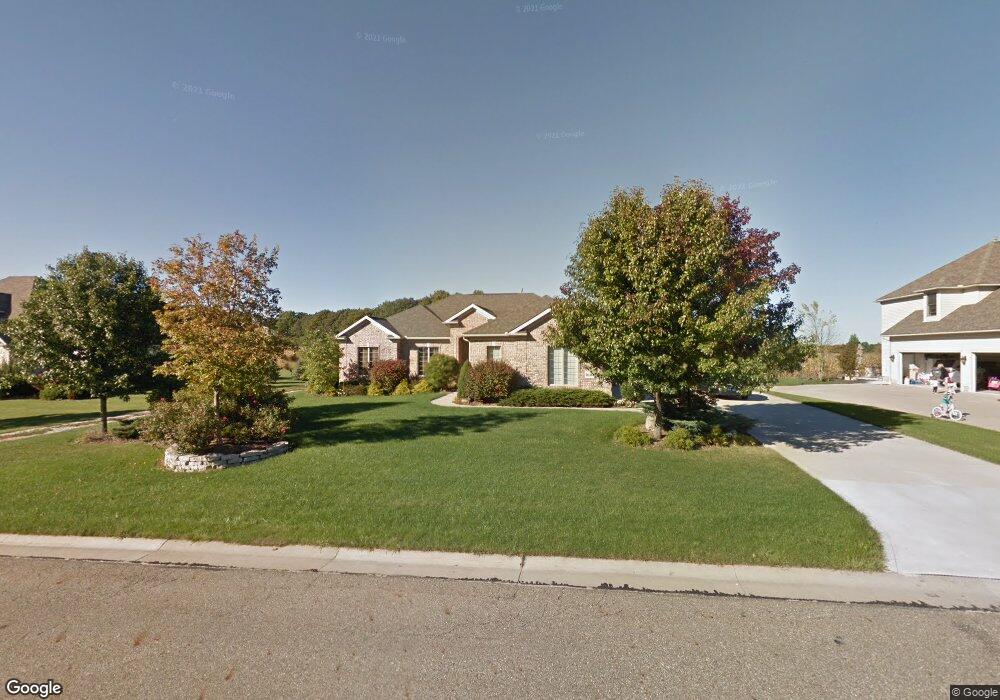
9185 Hunters Chase St NW Massillon, OH 44646
Amherst Heights-Clearview NeighborhoodEstimated Value: $494,345 - $621,000
3
Beds
3
Baths
2,482
Sq Ft
$222/Sq Ft
Est. Value
About This Home
This home is located at 9185 Hunters Chase St NW, Massillon, OH 44646 and is currently estimated at $551,586, approximately $222 per square foot. 9185 Hunters Chase St NW is a home located in Stark County with nearby schools including Strausser Elementary School, Jackson Memorial Middle School, and Jackson High School.
Ownership History
Date
Name
Owned For
Owner Type
Purchase Details
Closed on
Feb 2, 2024
Sold by
Eric Lynn Wells Revocable Trust
Bought by
Edmunds Edwin P and Edmunds Elizabeth A
Current Estimated Value
Purchase Details
Closed on
Nov 18, 2020
Sold by
Wells Eric L
Bought by
Wells Eric Lynn and Eric Lynn Wells Revocable Trus
Purchase Details
Closed on
Nov 22, 2004
Sold by
Rea Building Corp
Bought by
Wells Eric L
Home Financials for this Owner
Home Financials are based on the most recent Mortgage that was taken out on this home.
Original Mortgage
$125,000
Interest Rate
5.91%
Mortgage Type
Purchase Money Mortgage
Purchase Details
Closed on
Jun 4, 2004
Sold by
Lutz Group Llc
Bought by
Rea Building Corp
Home Financials for this Owner
Home Financials are based on the most recent Mortgage that was taken out on this home.
Original Mortgage
$270,000
Interest Rate
5.99%
Mortgage Type
Purchase Money Mortgage
Create a Home Valuation Report for This Property
The Home Valuation Report is an in-depth analysis detailing your home's value as well as a comparison with similar homes in the area
Home Values in the Area
Average Home Value in this Area
Purchase History
| Date | Buyer | Sale Price | Title Company |
|---|---|---|---|
| Edmunds Edwin P | $473,000 | None Listed On Document | |
| Wells Eric Lynn | -- | None Available | |
| Wells Eric L | $349,000 | -- | |
| Rea Building Corp | $59,000 | -- |
Source: Public Records
Mortgage History
| Date | Status | Borrower | Loan Amount |
|---|---|---|---|
| Previous Owner | Wells Eric L | $125,000 | |
| Previous Owner | Rea Building Corp | $270,000 |
Source: Public Records
Tax History Compared to Growth
Tax History
| Year | Tax Paid | Tax Assessment Tax Assessment Total Assessment is a certain percentage of the fair market value that is determined by local assessors to be the total taxable value of land and additions on the property. | Land | Improvement |
|---|---|---|---|---|
| 2025 | -- | $152,330 | $38,050 | $114,280 |
| 2024 | -- | $152,330 | $38,050 | $114,280 |
| 2023 | $6,422 | $128,530 | $35,390 | $93,140 |
| 2022 | $6,385 | $128,530 | $35,390 | $93,140 |
| 2021 | $6,410 | $128,530 | $35,390 | $93,140 |
| 2020 | $6,205 | $114,350 | $30,520 | $83,830 |
| 2019 | $5,977 | $114,350 | $30,520 | $83,830 |
| 2018 | $6,007 | $114,350 | $30,520 | $83,830 |
| 2017 | $6,194 | $112,210 | $27,580 | $84,630 |
| 2016 | $6,331 | $113,930 | $27,580 | $86,350 |
| 2015 | $6,408 | $113,930 | $27,580 | $86,350 |
| 2014 | $53 | $102,900 | $24,920 | $77,980 |
| 2013 | $2,977 | $102,900 | $24,920 | $77,980 |
Source: Public Records
Map
Nearby Homes
- 7040 Lutz Ave NW
- 8932 Franklin St NW
- 9042 Wolocott St NW
- 8853 Franklin St NW
- Asheville Plan at Heritage Park
- Boise Plan at Heritage Park
- 8920 Franklin NW
- 8937 Camden Rd NW
- 8933 Camden Rd NW
- 8932 Camden Rd NW
- 8928 Camden Rd NW
- 7479 Montella Ave NW
- 7601 Lutz Ave NW
- 7498 Greenview Ave NW
- 7596 Montella Ave NW
- 9729 Emerald Hill St NW
- 7087 Emerson Cir NW
- 7622 Greenview Ave NW
- 9725 Diamond Ridge Cir NW
- 7509 Galena Ave NW
- 9163 Hunters Chase St NW
- 9211 Hunters Chase St NW
- 9186 Hunters Chase St NW
- 9145 Hunters Chase St NW
- 9233 Hunters Chase St NW
- 9164 Hunters Chase St NW
- 7148 Wild Fox Run Ave NW
- 7141 Willowlane Ave NW
- 9119 Hunters Chase St NW
- 9251 Hunters Chase St NW
- 7124 Wild Fox Run Ave NW
- 9181 Goldenrod Cir NW
- 9167 Goldenrod Cir NW
- 7147 Wild Fox Run Ave NW
- 9113 Hunters Chase St NW
- 7106 Wild Fox Run Ave NW
- 7305 Lutz Ave NW
- 7154 Willowlane Ave NW
- 7091 Willowlane Ave NW
- 7136 Willowlane Ave NW