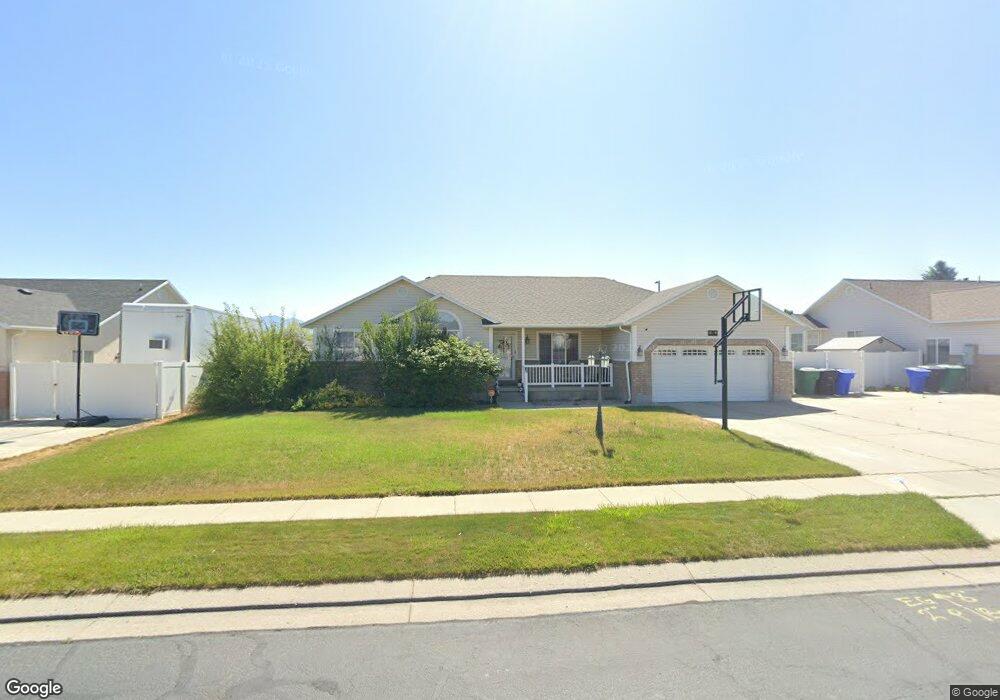
9185 S Mountain Laurel Ln West Jordan, UT 84081
Copper Hills NeighborhoodEstimated Value: $607,000 - $666,000
6
Beds
4
Baths
3,274
Sq Ft
$197/Sq Ft
Est. Value
About This Home
This home is located at 9185 S Mountain Laurel Ln, West Jordan, UT 84081 and is currently estimated at $645,728, approximately $197 per square foot. 9185 S Mountain Laurel Ln is a home located in Salt Lake County with nearby schools including Copper Canyon School, West Hills Middle School, and Copper Hills High School.
Ownership History
Date
Name
Owned For
Owner Type
Purchase Details
Closed on
Mar 30, 2021
Sold by
Johnson Timothy W
Bought by
Johnson Timothy W and Johnson Hailee Ann
Current Estimated Value
Home Financials for this Owner
Home Financials are based on the most recent Mortgage that was taken out on this home.
Original Mortgage
$200,000
Outstanding Balance
$180,576
Interest Rate
3%
Mortgage Type
New Conventional
Estimated Equity
$465,152
Purchase Details
Closed on
Feb 13, 1998
Sold by
Hj Builders Inc
Bought by
Wilson Mitchell C and Wilson Lisa R
Home Financials for this Owner
Home Financials are based on the most recent Mortgage that was taken out on this home.
Original Mortgage
$156,627
Interest Rate
6.98%
Create a Home Valuation Report for This Property
The Home Valuation Report is an in-depth analysis detailing your home's value as well as a comparison with similar homes in the area
Home Values in the Area
Average Home Value in this Area
Purchase History
| Date | Buyer | Sale Price | Title Company |
|---|---|---|---|
| Johnson Timothy W | -- | Metro National Title | |
| Johnson Timothy W | -- | Old Republic Ttl Draper Orem | |
| Wilson Mitchell C | -- | -- |
Source: Public Records
Mortgage History
| Date | Status | Borrower | Loan Amount |
|---|---|---|---|
| Open | Johnson Timothy W | $200,000 | |
| Previous Owner | Wilson Mitchell C | $156,627 |
Source: Public Records
Tax History Compared to Growth
Tax History
| Year | Tax Paid | Tax Assessment Tax Assessment Total Assessment is a certain percentage of the fair market value that is determined by local assessors to be the total taxable value of land and additions on the property. | Land | Improvement |
|---|---|---|---|---|
| 2025 | $2,989 | $594,000 | $177,100 | $416,900 |
| 2024 | $2,989 | $575,100 | $171,200 | $403,900 |
| 2023 | $3,028 | $549,000 | $167,900 | $381,100 |
| 2022 | $3,162 | $564,000 | $173,200 | $390,800 |
| 2021 | $2,438 | $396,000 | $132,500 | $263,500 |
| 2020 | $2,272 | $346,200 | $118,200 | $228,000 |
| 2019 | $2,288 | $342,000 | $118,200 | $223,800 |
| 2018 | $2,165 | $320,900 | $115,900 | $205,000 |
| 2017 | $1,960 | $289,300 | $115,900 | $173,400 |
| 2016 | $1,954 | $271,000 | $115,900 | $155,100 |
| 2015 | $1,849 | $250,000 | $112,600 | $137,400 |
| 2014 | $1,764 | $234,800 | $107,000 | $127,800 |
Source: Public Records
Map
Nearby Homes
- 4904 Wild Acres Dr
- 4707 W Granada Hills Ct
- 9332 S Wild Clover Ln
- 5098 Cherry Laurel Ln
- 4624 Pine Crossing Dr
- 9118 S Wisteria Way
- 9353 S 4460 W
- 4565 Lennox Dr
- 4887 W 8620 S
- 8941 S Sun Leaf Dr
- 8854 Rocky Creek Dr
- 8577 Autumn Gold Cir
- 4424 W Skye Dr
- 8793 S Big Bar Ct
- 5582 Washoe Cove
- 7903 Mckenzie Ln
- 7886 Mckenzie Ln
- 9375 S Laurel Ridge Cir
- 8359 Etude Dr
- 8441 S Spratling Dr
- 9185 Mountain Laurel Ln
- 9173 Mountain Laurel Ln
- 9173 S Mountain Laurel Ln
- 9199 Mountain Laurel Ln
- 9184 Mountain Laurel Ln
- 9184 S Mountain Laurel Ln
- 9157 S Mountain Laurel Ln
- 9157 Mountain Laurel Ln
- 9198 Mountain Laurel Ln
- 9213 S Mountain Laurel Ln
- 9213 Mountain Laurel Ln
- 9186 Ingram Dr
- 9174 Ingram Dr
- 9202 Ingram Dr
- 4842 Sundew Ln
- 9212 Mountain Laurel Ln
- 9162 Ingram Dr
- 9227 Mountain Laurel Ln
- 9183 Sundew Ct
- 9143 Mountain Laurel Ln