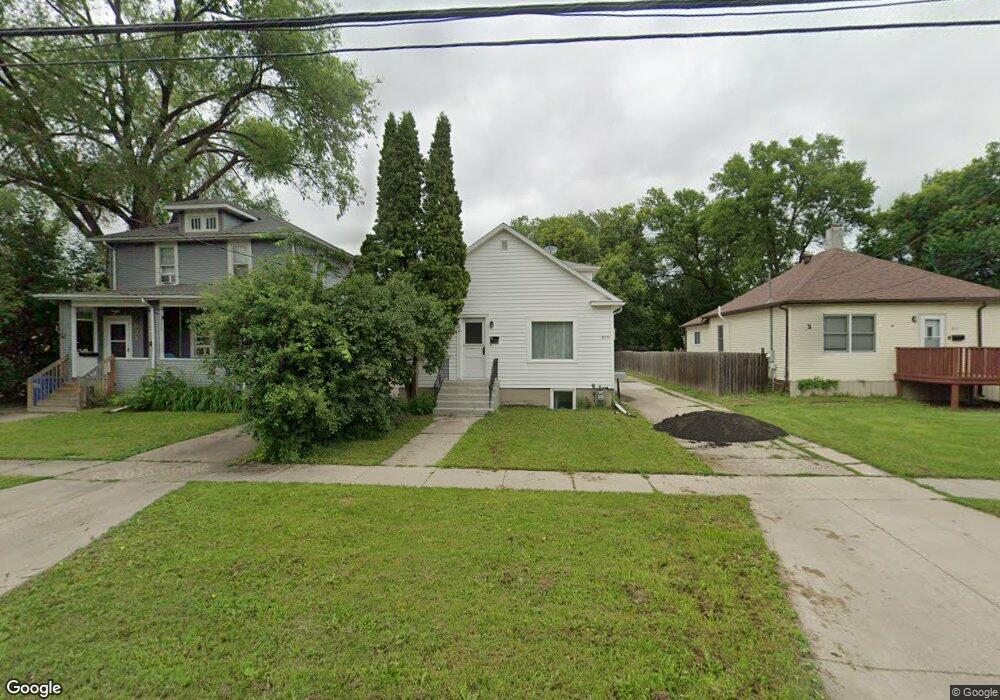
919 11th Ave N Fargo, ND 58102
Roosevelt NeighborhoodEstimated Value: $126,429 - $233,000
--
Bed
--
Bath
2,016
Sq Ft
$80/Sq Ft
Est. Value
About This Home
This home is located at 919 11th Ave N, Fargo, ND 58102 and is currently estimated at $161,607, approximately $80 per square foot. 919 11th Ave N is a home located in Cass County with nearby schools including Horace Mann Roosevelt Elementary School, Ben Franklin Middle School, and North High School.
Ownership History
Date
Name
Owned For
Owner Type
Purchase Details
Closed on
May 7, 2024
Sold by
Kounovsky Brian W and Kounovsky Kirsten J
Bought by
Pursuit Properties Llc
Current Estimated Value
Home Financials for this Owner
Home Financials are based on the most recent Mortgage that was taken out on this home.
Original Mortgage
$95,000
Outstanding Balance
$72,723
Interest Rate
6.79%
Mortgage Type
New Conventional
Estimated Equity
$88,884
Purchase Details
Closed on
Jan 22, 2010
Sold by
Kounovsky Donald W and Kounovsky Laurine J
Bought by
Kounovsky Brian W and Kounovsky Kirsten J
Purchase Details
Closed on
Jan 12, 2010
Sold by
Kounovsky Donald W and Kounovsky Laurine J
Bought by
Kounovsky Brian W and Kounovsky Kristen J
Purchase Details
Closed on
Dec 31, 2009
Sold by
Kounovsky Donald W and Kounovsky Laurine J
Bought by
Kounovsky Brian W and Kounovsky Kirsten J
Purchase Details
Closed on
Nov 13, 2008
Sold by
Jensen Maurice A and Jensen Kathy
Bought by
Kounovsky Donald W and Kounovsky Laurine J
Purchase Details
Closed on
Nov 12, 2008
Sold by
Jensen Maurice A and Jensen Kathy
Bought by
Kounovsky Donald W and Kounovsky Laurine J
Create a Home Valuation Report for This Property
The Home Valuation Report is an in-depth analysis detailing your home's value as well as a comparison with similar homes in the area
Home Values in the Area
Average Home Value in this Area
Purchase History
| Date | Buyer | Sale Price | Title Company |
|---|---|---|---|
| Pursuit Properties Llc | $118,750 | Regency Title | |
| Kounovsky Brian W | -- | -- | |
| Kounovsky Brian W | -- | -- | |
| Kounovsky Brian W | -- | -- | |
| Kounovsky Donald W | -- | -- | |
| Kounovsky Donald W | -- | -- |
Source: Public Records
Mortgage History
| Date | Status | Borrower | Loan Amount |
|---|---|---|---|
| Open | Pursuit Properties Llc | $95,000 |
Source: Public Records
Tax History Compared to Growth
Tax History
| Year | Tax Paid | Tax Assessment Tax Assessment Total Assessment is a certain percentage of the fair market value that is determined by local assessors to be the total taxable value of land and additions on the property. | Land | Improvement |
|---|---|---|---|---|
| 2024 | $2,598 | $84,750 | $14,750 | $70,000 |
| 2023 | $2,478 | $80,700 | $14,750 | $65,950 |
| 2022 | $2,261 | $75,400 | $14,750 | $60,650 |
| 2021 | $2,041 | $68,550 | $14,750 | $53,800 |
| 2020 | $2,017 | $68,550 | $14,750 | $53,800 |
| 2019 | $1,733 | $59,000 | $6,850 | $52,150 |
| 2018 | $1,713 | $59,000 | $6,850 | $52,150 |
| 2017 | $1,474 | $56,200 | $6,850 | $49,350 |
| 2016 | $1,315 | $54,550 | $6,850 | $47,700 |
| 2015 | $1,707 | $66,750 | $5,800 | $60,950 |
| 2014 | $1,526 | $58,050 | $5,800 | $52,250 |
| 2013 | $1,527 | $58,050 | $5,800 | $52,250 |
Source: Public Records
Map
Nearby Homes
- 1109 10th St N
- 1115 9th St N
- 1119 9th St N
- 802 11th Ave N
- 722 11th Ave N
- 1015 12th St N
- 703 & 705 10th Ave N
- 1111 7th St N
- 1036 12th St N
- 1001 9th Ave N
- 911 8th St N
- 824 9th St N
- 1012 12th St N
- 624 10th Ave N
- 1261 10th St N
- 1026 University Dr N
- 1119 Broadway N
- 611 9th Ave N
- 1010 University Dr N
- 915 Broadway N