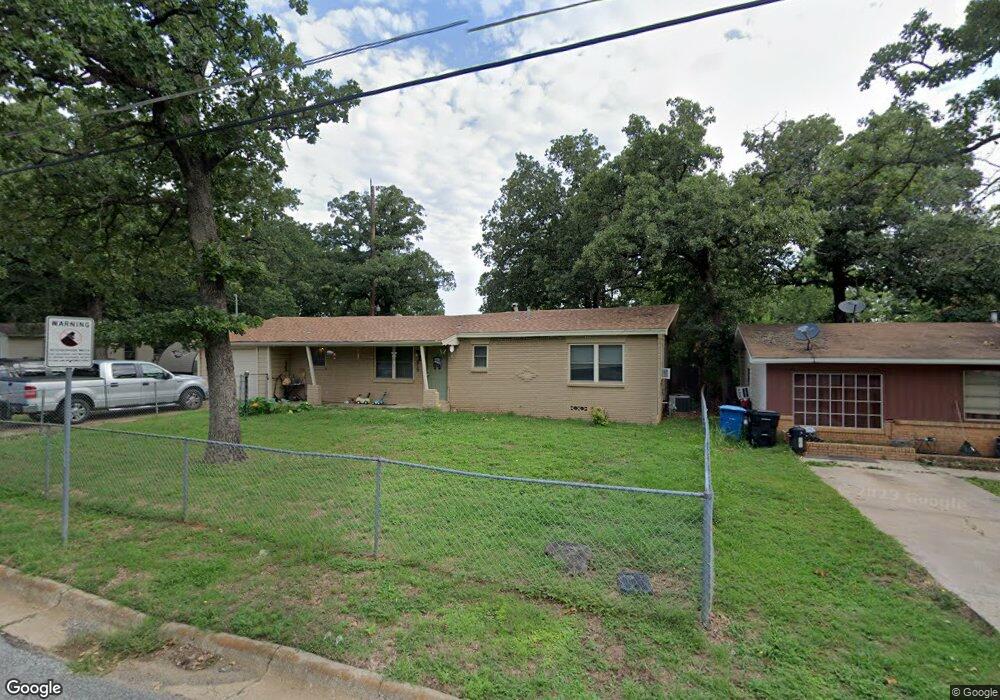
919 Amsden St Denison, TX 75020
Estimated Value: $150,022 - $191,000
--
Bed
--
Bath
1,218
Sq Ft
$140/Sq Ft
Est. Value
About This Home
This home is located at 919 Amsden St, Denison, TX 75020 and is currently estimated at $170,511, approximately $139 per square foot. 919 Amsden St is a home located in Grayson County with nearby schools including Scott Middle School, Denison High School, and St. Luke's Parish Day School.
Ownership History
Date
Name
Owned For
Owner Type
Purchase Details
Closed on
Apr 14, 2022
Sold by
Janiece Hallford Carolyn
Bought by
Hallford Lauren J
Current Estimated Value
Purchase Details
Closed on
Apr 27, 2007
Sold by
Anderson Donna Myers
Bought by
Hallford Louie A and Hallford Carolyn J
Create a Home Valuation Report for This Property
The Home Valuation Report is an in-depth analysis detailing your home's value as well as a comparison with similar homes in the area
Home Values in the Area
Average Home Value in this Area
Purchase History
| Date | Buyer | Sale Price | Title Company |
|---|---|---|---|
| Hallford Lauren J | -- | None Listed On Document | |
| Hallford Louie A | -- | Chapin Title Co Inc |
Source: Public Records
Tax History Compared to Growth
Tax History
| Year | Tax Paid | Tax Assessment Tax Assessment Total Assessment is a certain percentage of the fair market value that is determined by local assessors to be the total taxable value of land and additions on the property. | Land | Improvement |
|---|---|---|---|---|
| 2025 | $2,257 | $156,197 | $43,730 | $112,467 |
| 2024 | $3,509 | $151,054 | $36,841 | $114,213 |
| 2023 | $2,106 | $148,260 | $40,285 | $107,975 |
| 2022 | $3,316 | $139,552 | $40,285 | $99,267 |
| 2021 | $2,422 | $96,016 | $14,976 | $81,040 |
| 2020 | $2,502 | $94,841 | $11,232 | $83,609 |
| 2019 | $2,640 | $95,943 | $11,232 | $84,711 |
| 2018 | $2,167 | $78,099 | $5,466 | $72,633 |
| 2017 | $2,185 | $78,099 | $5,466 | $72,633 |
| 2016 | $1,702 | $60,841 | $5,466 | $55,375 |
| 2015 | $1,593 | $56,408 | $5,466 | $50,942 |
| 2014 | $1,528 | $54,074 | $5,466 | $48,608 |
Source: Public Records
Map
Nearby Homes
- 938 Amsden St
- 905 Seymore Cir
- 903 Seymore Cir
- 923 Dubois St
- 3101 S College Blvd
- 603 W Star St
- 700 Dubois St
- 711 Dubois St
- 1130 Amsden Cir
- 916 W Collins St
- 701 W Star St
- 923 W Collins St
- 921 W Collins St
- 919 W Collins St
- 601 Dubois St
- 3312 Vine Ln
- 608 W Baker St
- 611 W Baker St
- 607 W Baker St
- 614 W Collins St
- 915 Amsden St
- 933 Amsden St
- 913 Amsden St
- 920 Thatcher St
- 918 Amsden St
- 937 Amsden St
- 909 Amsden St
- 914 Amsden St
- 912 Thatcher St
- 941 Amsden St
- 908 Amsden St
- 901 Amsden St
- 908 Thatcher St
- 907 Seymore Cir
- 945 Amsden St
- 3001 S Scullin Ave
- 900 Amsden St
- 909 Seymore Cir
- 3000 S College Blvd
- 909 Thatcher St