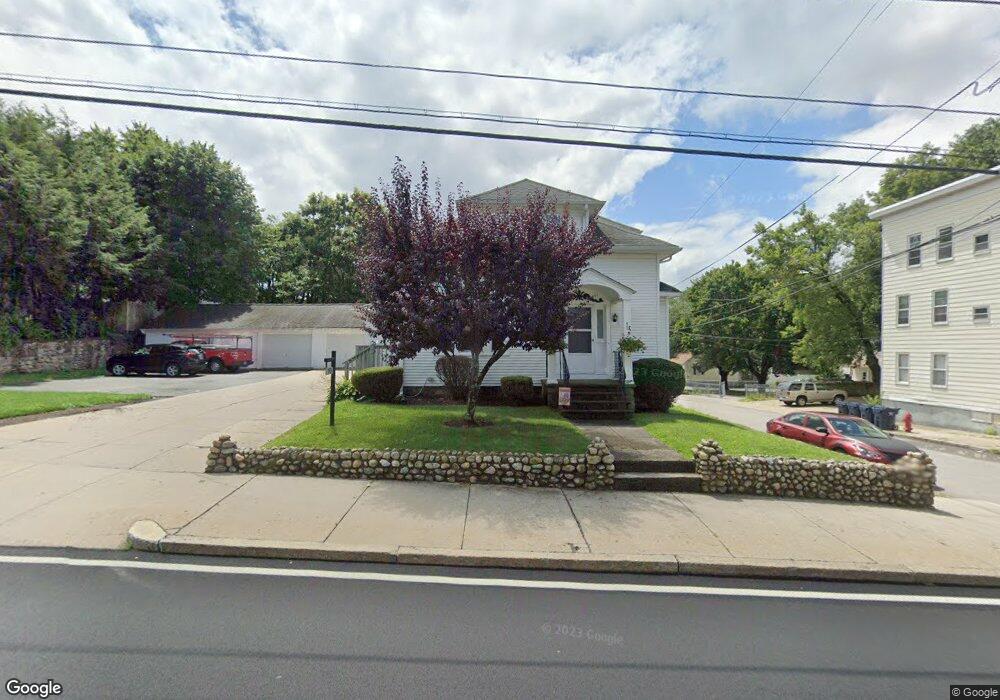
919 Cass Ave Woonsocket, RI 02895
East Woonsocket NeighborhoodEstimated Value: $413,000 - $522,000
3
Beds
2
Baths
1,496
Sq Ft
$305/Sq Ft
Est. Value
About This Home
This home is located at 919 Cass Ave, Woonsocket, RI 02895 and is currently estimated at $456,386, approximately $305 per square foot. 919 Cass Ave is a home located in Providence County with nearby schools including Woonsocket High School and Good Shepherd Catholic School.
Ownership History
Date
Name
Owned For
Owner Type
Purchase Details
Closed on
Dec 7, 1998
Sold by
Provoyeur Roger and Provoyeur Eileen
Bought by
Perron Roy A
Current Estimated Value
Home Financials for this Owner
Home Financials are based on the most recent Mortgage that was taken out on this home.
Original Mortgage
$87,200
Interest Rate
6.68%
Mortgage Type
Purchase Money Mortgage
Create a Home Valuation Report for This Property
The Home Valuation Report is an in-depth analysis detailing your home's value as well as a comparison with similar homes in the area
Home Values in the Area
Average Home Value in this Area
Purchase History
| Date | Buyer | Sale Price | Title Company |
|---|---|---|---|
| Perron Roy A | $109,000 | -- | |
| Perron Roy A | $109,000 | -- |
Source: Public Records
Mortgage History
| Date | Status | Borrower | Loan Amount |
|---|---|---|---|
| Open | Perron Roy A | $113,800 | |
| Closed | Perron Roy A | $110,500 | |
| Closed | Perron Roy A | $87,200 |
Source: Public Records
Tax History
| Year | Tax Paid | Tax Assessment Tax Assessment Total Assessment is a certain percentage of the fair market value that is determined by local assessors to be the total taxable value of land and additions on the property. | Land | Improvement |
|---|---|---|---|---|
| 2025 | $4,413 | $393,000 | $107,600 | $285,400 |
| 2024 | $4,202 | $289,000 | $95,500 | $193,500 |
| 2023 | $4,040 | $289,000 | $95,500 | $193,500 |
| 2022 | $4,040 | $289,000 | $95,500 | $193,500 |
| 2021 | $4,156 | $175,000 | $60,000 | $115,000 |
| 2020 | $4,200 | $175,000 | $60,000 | $115,000 |
| 2018 | $4,214 | $175,000 | $60,000 | $115,000 |
| 2017 | $4,656 | $154,700 | $46,900 | $107,800 |
| 2016 | $4,926 | $154,700 | $46,900 | $107,800 |
| 2015 | $5,659 | $154,700 | $46,900 | $107,800 |
| 2014 | $4,669 | $129,900 | $51,600 | $78,300 |
Source: Public Records
Map
Nearby Homes
- 68 Kenwood St
- 366 Aylsworth Ave
- 375 Congress St
- 0 Laval St
- 60 Ruskin Ave
- 372 Cumberland Hill Rd
- 568 Elm St
- 417 Elder Ballou Meeting House Rd
- 191 Nimitz Rd
- 77 Theresa Marie Ave
- 1175 Diamond Hill Rd Unit 305
- 56 Mailloux St
- 7 Theresa Marie Ave
- 51 Wood Ave
- 124 Saint Leon Ave
- 213 St Louis Ave
- 1088 Diamond Hill Rd
- 311 Elm St
- 212 Saint Louis Ave
- 255 Knollwood Dr
Your Personal Tour Guide
Ask me questions while you tour the home.