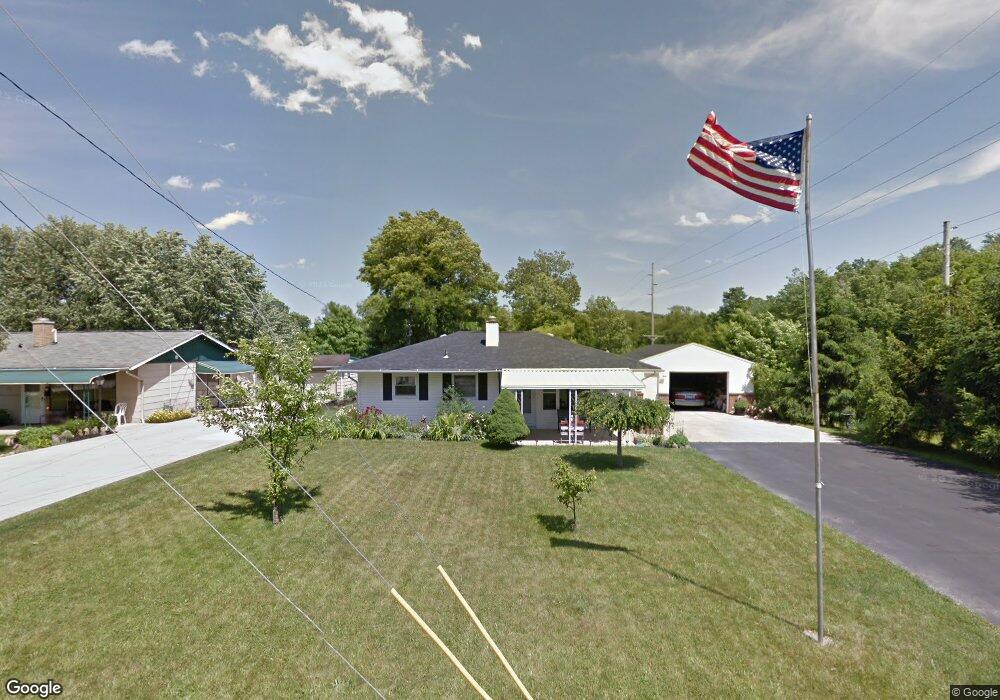
919 Danwood Ave Mansfield, OH 44907
Estimated Value: $144,000 - $186,000
3
Beds
1
Bath
925
Sq Ft
$172/Sq Ft
Est. Value
About This Home
This home is located at 919 Danwood Ave, Mansfield, OH 44907 and is currently estimated at $159,370, approximately $172 per square foot. 919 Danwood Ave is a home located in Richland County with nearby schools including St. Peter's Elementary/Montessori School, St. Peter's High School/Junior High, and Mansfield Christian School.
Ownership History
Date
Name
Owned For
Owner Type
Purchase Details
Closed on
Sep 24, 2021
Sold by
Mowry Jerry Brandon
Bought by
Funk Stacey and Barnett Justin L
Current Estimated Value
Home Financials for this Owner
Home Financials are based on the most recent Mortgage that was taken out on this home.
Original Mortgage
$108,007
Outstanding Balance
$98,492
Interest Rate
2.8%
Mortgage Type
FHA
Estimated Equity
$60,878
Purchase Details
Closed on
Jun 3, 2019
Sold by
Chance Dianna C and Godare Dana L
Bought by
Mowry Jerry Brandon
Home Financials for this Owner
Home Financials are based on the most recent Mortgage that was taken out on this home.
Original Mortgage
$68,870
Interest Rate
4.1%
Mortgage Type
New Conventional
Purchase Details
Closed on
Jun 19, 1990
Create a Home Valuation Report for This Property
The Home Valuation Report is an in-depth analysis detailing your home's value as well as a comparison with similar homes in the area
Home Values in the Area
Average Home Value in this Area
Purchase History
| Date | Buyer | Sale Price | Title Company |
|---|---|---|---|
| Funk Stacey | $110,000 | Tha Title Llc | |
| Mowry Jerry Brandon | $71,000 | Chicago Title | |
| -- | $24,000 | -- |
Source: Public Records
Mortgage History
| Date | Status | Borrower | Loan Amount |
|---|---|---|---|
| Open | Funk Stacey | $108,007 | |
| Previous Owner | Mowry Jerry Brandon | $68,870 |
Source: Public Records
Tax History Compared to Growth
Tax History
| Year | Tax Paid | Tax Assessment Tax Assessment Total Assessment is a certain percentage of the fair market value that is determined by local assessors to be the total taxable value of land and additions on the property. | Land | Improvement |
|---|---|---|---|---|
| 2024 | $1,509 | $37,360 | $6,810 | $30,550 |
| 2023 | $1,509 | $37,360 | $6,810 | $30,550 |
| 2022 | $1,083 | $24,790 | $5,660 | $19,130 |
| 2021 | $1,083 | $24,790 | $5,660 | $19,130 |
| 2020 | $1,094 | $24,790 | $5,660 | $19,130 |
| 2019 | $610 | $21,230 | $4,800 | $16,430 |
| 2018 | $604 | $21,230 | $4,800 | $16,430 |
| 2017 | $592 | $21,230 | $4,800 | $16,430 |
| 2016 | $579 | $20,680 | $4,560 | $16,120 |
| 2015 | $579 | $20,680 | $4,560 | $16,120 |
| 2014 | $566 | $20,680 | $4,560 | $16,120 |
| 2012 | $524 | $21,770 | $4,800 | $16,970 |
Source: Public Records
Map
Nearby Homes
- 794 Mansfield Washington Rd
- 716 Mansfield Washington Rd
- 405 Plainview Ave
- 33 Rambleside Dr
- 413 Ruby Ave
- 430 Beethoven St
- 419 Pearl Ave
- 104 Elmridge Rd
- 0 Woodville Rd Unit Lot 14952, 14953
- 0 Woodville Rd Unit Lot 14954, 14955
- 0 Woodville Rd Unit Lot 14956, 14957,
- 519 S Diamond St
- 369 Davidson St
- 350 Davidson St
- 136 Elmridge Rd
- 84 W Raleigh Ave
- 153 Ford St
- 65 Logan Rd
- 179 Chilton Ave
- 353 Home Ave
- 911 Danwood Ave
- 905 Danwood Ave
- 912 Cecilwood Dr
- 912 Cecilwood Rd
- 920 Danwood Rd
- 912 Danwood Rd
- 899 Danwood Ave
- 906 Cecilwood Dr
- 920 Danwood Ave
- 918 Cecilwood Dr
- 912 Danwood Ave
- 906 Danwood Ave
- 900 Cecilwood Dr
- 891 Danwood Ave
- 900 Danwood Ave
- 892 Cecilwood Dr
- 885 Danwood Ave
- 892 Danwood Ave
- 886 Danwood Ave
- 905 Cecilwood Dr