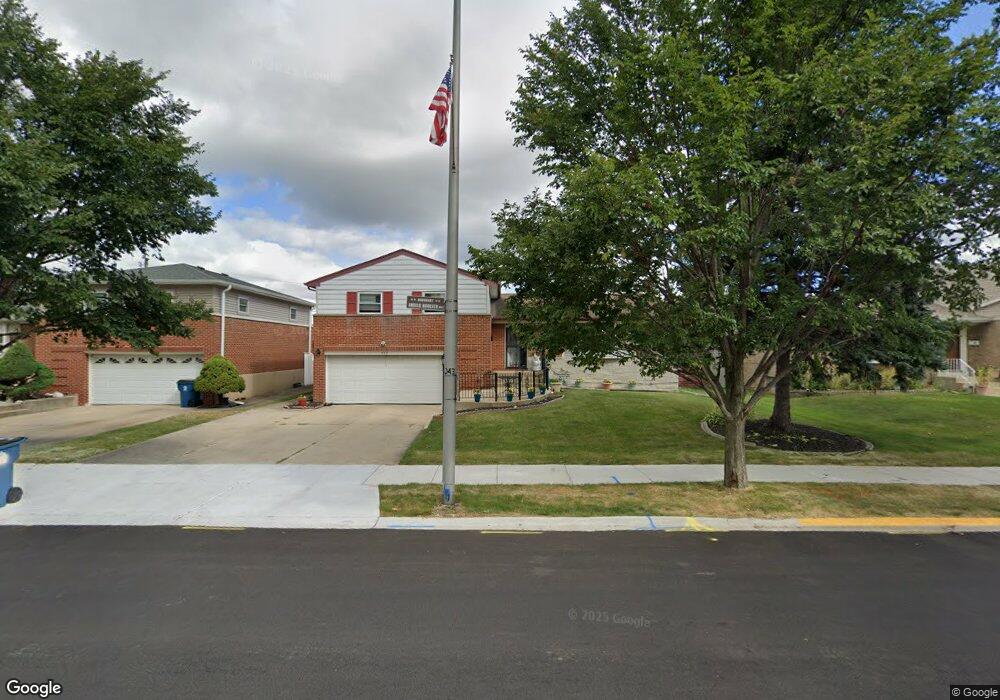
919 Division St Melrose Park, IL 60160
Estimated Value: $417,438 - $465,000
4
Beds
3
Baths
1,918
Sq Ft
$226/Sq Ft
Est. Value
About This Home
This home is located at 919 Division St, Melrose Park, IL 60160 and is currently estimated at $432,610, approximately $225 per square foot. 919 Division St is a home located in Cook County with nearby schools including Jane Addams Elementary School, Stevenson Middle School, and Proviso East High School.
Ownership History
Date
Name
Owned For
Owner Type
Purchase Details
Closed on
Jul 31, 2008
Sold by
North Star Trust Co
Bought by
Dindia Frank A
Current Estimated Value
Home Financials for this Owner
Home Financials are based on the most recent Mortgage that was taken out on this home.
Original Mortgage
$217,000
Outstanding Balance
$142,842
Interest Rate
6.39%
Mortgage Type
Unknown
Estimated Equity
$289,768
Purchase Details
Closed on
Mar 6, 1999
Sold by
Brocato Angelo
Bought by
Continental Community Bank & Trust Co and Trust #10378
Purchase Details
Closed on
Oct 30, 1996
Sold by
Kaiser Charles J and Kaiser Marilyn S
Bought by
Brocato Angelo
Home Financials for this Owner
Home Financials are based on the most recent Mortgage that was taken out on this home.
Original Mortgage
$123,750
Interest Rate
8.12%
Create a Home Valuation Report for This Property
The Home Valuation Report is an in-depth analysis detailing your home's value as well as a comparison with similar homes in the area
Home Values in the Area
Average Home Value in this Area
Purchase History
| Date | Buyer | Sale Price | Title Company |
|---|---|---|---|
| Dindia Frank A | $290,000 | Prairie Title Inc | |
| Continental Community Bank & Trust Co | -- | -- | |
| Brocato Angelo | $165,000 | Attorneys Natl Title Network |
Source: Public Records
Mortgage History
| Date | Status | Borrower | Loan Amount |
|---|---|---|---|
| Open | Dindia Frank A | $217,000 | |
| Previous Owner | Brocato Angelo | $123,750 |
Source: Public Records
Tax History Compared to Growth
Tax History
| Year | Tax Paid | Tax Assessment Tax Assessment Total Assessment is a certain percentage of the fair market value that is determined by local assessors to be the total taxable value of land and additions on the property. | Land | Improvement |
|---|---|---|---|---|
| 2024 | $7,025 | $33,000 | $4,550 | $28,450 |
| 2023 | $4,896 | $33,000 | $4,550 | $28,450 |
| 2022 | $4,896 | $22,045 | $3,900 | $18,145 |
| 2021 | $5,022 | $22,044 | $3,900 | $18,144 |
| 2020 | $6,183 | $23,429 | $3,900 | $19,529 |
| 2019 | $5,548 | $20,543 | $3,575 | $16,968 |
| 2018 | $6,027 | $22,094 | $3,575 | $18,519 |
| 2017 | $5,910 | $22,094 | $3,575 | $18,519 |
| 2016 | $5,183 | $18,669 | $3,250 | $15,419 |
| 2015 | $5,063 | $18,669 | $3,250 | $15,419 |
| 2014 | $4,922 | $18,669 | $3,250 | $15,419 |
| 2013 | $4,788 | $19,687 | $3,250 | $16,437 |
Source: Public Records
Map
Nearby Homes
- 921 Division St
- 917 Division St
- 916 Helen Dr
- 918 Helen Dr
- 914 Helen Dr
- 915 Division St
- 920 Helen Dr
- 912 Helen Dr
- 1419 N 11th Ave
- 1419 N 11th Ave
- 913 Division St
- 1417 N 11th Ave
- 925 Division St
- 922 Helen Dr
- 910 Helen Dr Unit 1
- 1100 Division St
- 917 Helen Dr
- 919 Helen Dr
- 911 Division St
- 1409 N 11th Ave