Estimated Value: $612,000 - $714,000
4
Beds
3
Baths
1,824
Sq Ft
$366/Sq Ft
Est. Value
About This Home
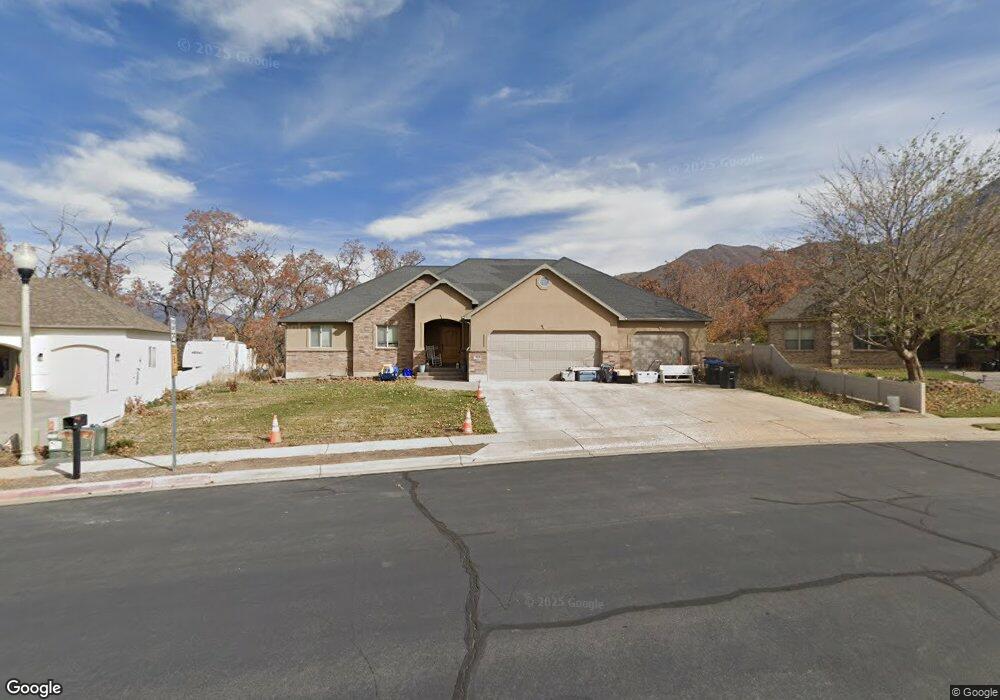
This home is located at 919 E 240 S, Salem, UT 84653 and is currently estimated at $668,139, approximately $366 per square foot. 919 E 240 S is a home located in Utah County with nearby schools including Foothills Elementary School, Valley View Middle School, and Salem Junior High School.
Ownership History
Date
Name
Owned For
Owner Type
Purchase Details
Closed on
Oct 18, 2019
Sold by
Lyman Kevin K
Bought by
Lyman Kevin K and Lyman Deborah D
Current Estimated Value
Home Financials for this Owner
Home Financials are based on the most recent Mortgage that was taken out on this home.
Original Mortgage
$275,000
Outstanding Balance
$183,337
Interest Rate
3.5%
Mortgage Type
New Conventional
Estimated Equity
$484,802
Purchase Details
Closed on
Jul 26, 2005
Sold by
Lyman Kevin K
Bought by
Lyman Kevin K and Lyman Deborah D
Home Financials for this Owner
Home Financials are based on the most recent Mortgage that was taken out on this home.
Original Mortgage
$218,000
Interest Rate
5.56%
Mortgage Type
Construction
Purchase Details
Closed on
Sep 24, 2004
Sold by
Robert Nelson Construction Llc
Bought by
Lyman Kevin K
Home Financials for this Owner
Home Financials are based on the most recent Mortgage that was taken out on this home.
Original Mortgage
$6,000
Interest Rate
5.76%
Mortgage Type
Seller Take Back
Create a Home Valuation Report for This Property
The Home Valuation Report is an in-depth analysis detailing your home's value as well as a comparison with similar homes in the area
Home Values in the Area
Average Home Value in this Area
Purchase History
| Date | Buyer | Sale Price | Title Company |
|---|---|---|---|
| Lyman Kevin K | -- | Accommodation | |
| Lyman Kevin K | -- | Accommodation | |
| Lyman Kevin K | -- | Provo Land Title Co | |
| Lyman Kevin K | -- | Pro Title & Escrow Inc |
Source: Public Records
Mortgage History
| Date | Status | Borrower | Loan Amount |
|---|---|---|---|
| Open | Lyman Kevin K | $275,000 | |
| Closed | Lyman Kevin K | $218,000 | |
| Closed | Lyman Kevin K | $6,000 |
Source: Public Records
Tax History
| Year | Tax Paid | Tax Assessment Tax Assessment Total Assessment is a certain percentage of the fair market value that is determined by local assessors to be the total taxable value of land and additions on the property. | Land | Improvement |
|---|---|---|---|---|
| 2025 | $3,041 | $335,005 | -- | -- |
| 2024 | $3,041 | $308,385 | $0 | $0 |
| 2023 | $3,082 | $313,115 | $0 | $0 |
| 2022 | $3,272 | $327,250 | $0 | $0 |
| 2021 | $2,568 | $412,100 | $126,200 | $285,900 |
| 2020 | $2,529 | $395,000 | $114,700 | $280,300 |
| 2019 | $2,421 | $386,200 | $105,900 | $280,300 |
| 2018 | $2,533 | $386,200 | $105,900 | $280,300 |
| 2017 | $2,504 | $203,610 | $0 | $0 |
| 2016 | $2,243 | $180,235 | $0 | $0 |
| 2015 | $2,011 | $158,730 | $0 | $0 |
| 2014 | $1,790 | $141,515 | $0 | $0 |
Source: Public Records
Map
Nearby Homes
- 1003 E 310 S Unit 11
- 1018 E 250 S
- 1026 E 310 S
- 1034 E 250 S
- 1036 E 310 S
- 1033 E 250 S
- 88 S 850 E
- 173 E 10000 S
- 822 E 540 S
- 85 N 900 E
- 9800 Woodland Hills Dr
- 180 Woodland Hills Dr
- 881 E 820 S
- 1939 E Dorset Way Unit 306
- 1965 E Dorset Way Unit 303
- 1984 E Dorset Way Unit 279
- 1802 E Albion Dr Unit 1142
- 1968 E Dorset Way Unit 277
- 84 N 500 E
- 2153 E 270 N Unit PINEVI
Your Personal Tour Guide
Ask me questions while you tour the home.