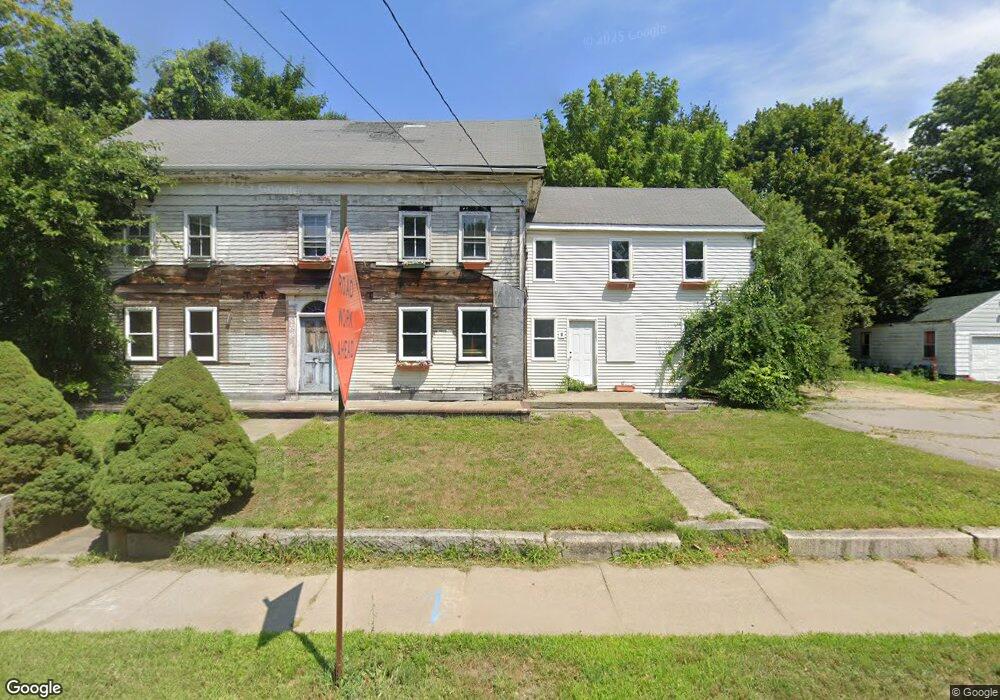
919 East St Walpole, MA 02081
Estimated Value: $615,000 - $850,000
5
Beds
1
Bath
2,622
Sq Ft
$277/Sq Ft
Est. Value
About This Home
This home is located at 919 East St, Walpole, MA 02081 and is currently estimated at $726,726, approximately $277 per square foot. 919 East St is a home located in Norfolk County with nearby schools including Fisher School, Walpole Middle School, and Walpole High School.
Ownership History
Date
Name
Owned For
Owner Type
Purchase Details
Closed on
Feb 1, 2001
Sold by
Betro Gerald J
Bought by
Heritage Const&Dev Inc
Current Estimated Value
Home Financials for this Owner
Home Financials are based on the most recent Mortgage that was taken out on this home.
Original Mortgage
$102,000
Outstanding Balance
$37,009
Interest Rate
7.14%
Mortgage Type
Purchase Money Mortgage
Estimated Equity
$689,717
Create a Home Valuation Report for This Property
The Home Valuation Report is an in-depth analysis detailing your home's value as well as a comparison with similar homes in the area
Home Values in the Area
Average Home Value in this Area
Purchase History
| Date | Buyer | Sale Price | Title Company |
|---|---|---|---|
| Heritage Const&Dev Inc | $145,000 | -- |
Source: Public Records
Mortgage History
| Date | Status | Borrower | Loan Amount |
|---|---|---|---|
| Open | Heritage Const&Dev Inc | $102,000 |
Source: Public Records
Tax History Compared to Growth
Tax History
| Year | Tax Paid | Tax Assessment Tax Assessment Total Assessment is a certain percentage of the fair market value that is determined by local assessors to be the total taxable value of land and additions on the property. | Land | Improvement |
|---|---|---|---|---|
| 2025 | $5,068 | $395,000 | $306,300 | $88,700 |
| 2024 | $6,589 | $498,400 | $294,600 | $203,800 |
| 2023 | $6,214 | $447,400 | $256,000 | $191,400 |
| 2022 | $5,862 | $405,400 | $237,100 | $168,300 |
| 2021 | $5,737 | $386,600 | $223,700 | $162,900 |
| 2020 | $5,527 | $368,700 | $211,000 | $157,700 |
| 2019 | $5,495 | $363,900 | $203,300 | $160,600 |
| 2018 | $5,381 | $352,400 | $194,800 | $157,600 |
| 2017 | $5,201 | $339,300 | $187,300 | $152,000 |
| 2016 | $5,290 | $340,000 | $181,800 | $158,200 |
| 2015 | $5,351 | $340,800 | $174,300 | $166,500 |
| 2014 | $5,061 | $321,100 | $174,300 | $146,800 |
Source: Public Records
Map
Nearby Homes
- 65-67 Diamond St
- 103 Centre Ln
- 9 Greenwood Rd Unit 11
- 305 Centre Ln
- 4 Kendall St
- 17 Charles St
- 1188 Main St
- 24 Pelican Dr
- 9 Grist Mill Ln
- 22 Holly Rd
- 158 Clear Pond Dr Unit 158
- 127 Clear Pond Dr
- 291 Plimpton St
- 2 Sterling Ln Unit 2
- 16 Magpie Cir Unit 16
- 12 Thomas St
- 11 Crane Rd
- 2 Alexandra Way
- 1165 Washington St
- 1391 Main St Unit 208
- 919 East St Unit 1
- 915 East St
- 923 East St Unit 923
- 925 East St Unit 923-925
- 927 East St
- 927 East St Unit B
- 927 East St Unit B
- 927 East St Unit A
- 105 School St
- 107 School St
- 107 School St Unit 107
- 931 East St
- 931 East St Unit 931
- 894 East St Unit 6
- 894 East St Unit 5
- 894 East St Unit 4
- 894 East St Unit 3
- 894 East St Unit 2
- 894 East St Unit 1
- 929 East St