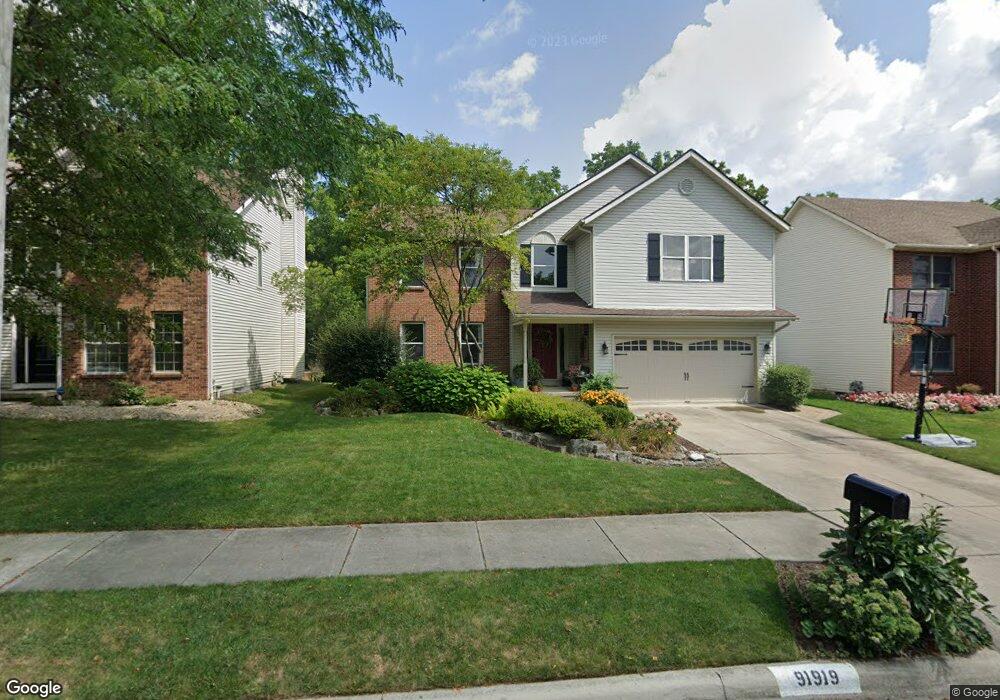
919 Executive Blvd Delaware, OH 43015
Estimated Value: $393,975 - $445,000
4
Beds
3
Baths
2,456
Sq Ft
$170/Sq Ft
Est. Value
About This Home
This home is located at 919 Executive Blvd, Delaware, OH 43015 and is currently estimated at $418,744, approximately $170 per square foot. 919 Executive Blvd is a home located in Delaware County with nearby schools including David Smith Elementary School, John C. Dempsey Middle School, and Rutherford B. Hayes High School.
Ownership History
Date
Name
Owned For
Owner Type
Purchase Details
Closed on
Feb 29, 2008
Sold by
Riggs Dale A and Riggs Juliana M
Bought by
Riggs Dale A and Riggs Juliana M
Current Estimated Value
Purchase Details
Closed on
Sep 6, 2007
Sold by
Houk Stephen A and Houk Bonnie C
Bought by
Riggs Dale A and Riggs Juliana M
Home Financials for this Owner
Home Financials are based on the most recent Mortgage that was taken out on this home.
Original Mortgage
$208,905
Outstanding Balance
$133,278
Interest Rate
6.72%
Mortgage Type
Purchase Money Mortgage
Estimated Equity
$285,466
Purchase Details
Closed on
Dec 3, 1997
Sold by
Kenneth M Parrish
Bought by
Houk Stephen A and Houk Bonnie C
Home Financials for this Owner
Home Financials are based on the most recent Mortgage that was taken out on this home.
Original Mortgage
$170,905
Interest Rate
7.46%
Mortgage Type
New Conventional
Create a Home Valuation Report for This Property
The Home Valuation Report is an in-depth analysis detailing your home's value as well as a comparison with similar homes in the area
Home Values in the Area
Average Home Value in this Area
Purchase History
| Date | Buyer | Sale Price | Title Company |
|---|---|---|---|
| Riggs Dale A | -- | Attorney | |
| Riggs Dale A | $219,900 | Attorney | |
| Houk Stephen A | $179,900 | -- |
Source: Public Records
Mortgage History
| Date | Status | Borrower | Loan Amount |
|---|---|---|---|
| Open | Riggs Dale A | $208,905 | |
| Previous Owner | Houk Stephen A | $170,905 |
Source: Public Records
Tax History
| Year | Tax Paid | Tax Assessment Tax Assessment Total Assessment is a certain percentage of the fair market value that is determined by local assessors to be the total taxable value of land and additions on the property. | Land | Improvement |
|---|---|---|---|---|
| 2024 | $5,667 | $120,020 | $13,090 | $106,930 |
| 2023 | $5,677 | $120,020 | $13,090 | $106,930 |
| 2022 | $5,399 | $99,060 | $15,230 | $83,830 |
| 2021 | $5,519 | $99,060 | $15,230 | $83,830 |
| 2020 | $5,581 | $99,060 | $15,230 | $83,830 |
| 2019 | $4,796 | $77,140 | $12,180 | $64,960 |
| 2018 | $4,862 | $77,140 | $12,180 | $64,960 |
| 2017 | $4,444 | $70,390 | $10,960 | $59,430 |
| 2016 | $4,049 | $70,390 | $10,960 | $59,430 |
| 2015 | $4,071 | $70,390 | $10,960 | $59,430 |
| 2014 | $4,136 | $70,390 | $10,960 | $59,430 |
| 2013 | $3,992 | $67,560 | $10,960 | $56,600 |
Source: Public Records
Map
Nearby Homes
- 846 Executive Blvd
- 94 Aldersgate Dr
- 76 Aldersgate Dr
- 81 Coldstone Ct
- 58 Aldersgate Dr
- 72 Allenhurst Way
- 93 Aldersgate Dr
- 69 Coldstone Ct
- 117 Aldersgate Dr
- 51 Coldstone Ct
- 208 Shelbourne Forest Way
- 2199 Hope Ln
- 5305 U S Highway 23 N
- 5722 U S Highway 23 N
- 5730 U S Highway 23 N
- 5738 U S Highway 23 N
- 688 Birchard Ave
- 602 Heritage Blvd
- 632 Rutherford Ave
- 451 Federal Cir
- 925 Executive Blvd
- 913 Executive Blvd
- 931 Executive Blvd
- 907 Executive Blvd
- 937 Executive Blvd
- 914 Executive Blvd
- 901 Executive Blvd
- 926 Executive Blvd
- 902 Executive Blvd
- 932 Executive Blvd
- 943 Executive Blvd
- 895 Executive Blvd
- 890 Executive Blvd
- 938 Executive Blvd
- 949 Executive Blvd
- 358 Pinecrest Ct
- 107 Straton Dr
- 878 Executive Blvd
- 889 Executive Blvd
- 352 Pinecrest Ct
Your Personal Tour Guide
Ask me questions while you tour the home.