Estimated Value: $271,141 - $326,000
3
Beds
2
Baths
1,104
Sq Ft
$277/Sq Ft
Est. Value
About This Home
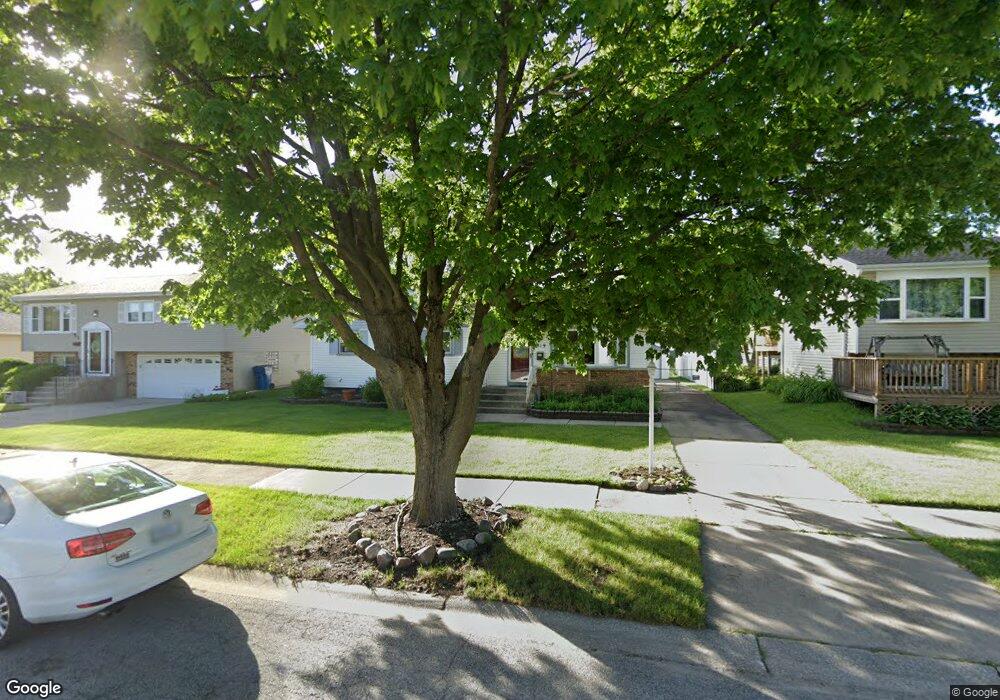
This home is located at 919 Jackson Place, Dyer, IN 46311 and is currently estimated at $305,535, approximately $276 per square foot. 919 Jackson Place is a home located in Lake County with nearby schools including Protsman Elementary School, Kahler Middle School, and Lake Central High School.
Ownership History
Date
Name
Owned For
Owner Type
Purchase Details
Closed on
Nov 12, 2020
Sold by
Wander Christopher P and Wander Angela T
Bought by
Wander Angela T
Current Estimated Value
Home Financials for this Owner
Home Financials are based on the most recent Mortgage that was taken out on this home.
Original Mortgage
$140,000
Outstanding Balance
$111,465
Interest Rate
2.8%
Mortgage Type
New Conventional
Estimated Equity
$194,070
Purchase Details
Closed on
May 21, 2010
Sold by
Jenks Daniel
Bought by
Wander Christopher P and Wander Angela T
Home Financials for this Owner
Home Financials are based on the most recent Mortgage that was taken out on this home.
Original Mortgage
$166,260
Interest Rate
5.5%
Mortgage Type
FHA
Purchase Details
Closed on
Jan 8, 2010
Sold by
Kettell Todd A and Wells Fargo Home Mortgage Inc
Bought by
Jenks Daniel
Create a Home Valuation Report for This Property
The Home Valuation Report is an in-depth analysis detailing your home's value as well as a comparison with similar homes in the area
Home Values in the Area
Average Home Value in this Area
Purchase History
| Date | Buyer | Sale Price | Title Company |
|---|---|---|---|
| Wander Angela T | -- | None Available | |
| Wander Christopher P | -- | Indiana Title Network Co | |
| Jenks Daniel | $110,184 | None Available |
Source: Public Records
Mortgage History
| Date | Status | Borrower | Loan Amount |
|---|---|---|---|
| Open | Wander Angela T | $140,000 | |
| Closed | Wander Christopher P | $166,260 |
Source: Public Records
Tax History
| Year | Tax Paid | Tax Assessment Tax Assessment Total Assessment is a certain percentage of the fair market value that is determined by local assessors to be the total taxable value of land and additions on the property. | Land | Improvement |
|---|---|---|---|---|
| 2025 | $2,588 | $276,300 | $64,800 | $211,500 |
| 2024 | $2,588 | $250,900 | $64,800 | $186,100 |
| 2023 | $2,714 | $242,500 | $64,800 | $177,700 |
| 2022 | $2,714 | $233,000 | $64,800 | $168,200 |
| 2021 | $2,438 | $218,000 | $64,800 | $153,200 |
| 2020 | $2,326 | $205,300 | $54,100 | $151,200 |
| 2019 | $2,098 | $179,200 | $24,900 | $154,300 |
| 2018 | $1,932 | $173,000 | $24,900 | $148,100 |
| 2017 | $1,653 | $162,400 | $24,900 | $137,500 |
| 2016 | $1,665 | $161,600 | $24,900 | $136,700 |
| 2014 | $1,533 | $159,600 | $24,900 | $134,700 |
| 2013 | $1,528 | $157,500 | $24,900 | $132,600 |
Source: Public Records
Map
Nearby Homes
- 1025 Windsor Ln
- 824 Polk Ave
- 748 Wellington Dr
- 828 Royal Dublin Ln
- 601 Berkley Dr
- 605 Pierce Ave
- 811 Royal Dublin Ln
- 917 Perthshire Ln
- 530 Pierce Ave
- 1141 Portmarnock Ct
- 901 Robin Ct
- 444 Megan Way
- 10419 Allison Rd
- 902 Cornwallis Ln
- 955 Killarney Dr
- 1416 Sheffield Ave
- 1341 Capri Ln
- 10317 Margo Ln
- 10230 Barbara Ln
- 10221 Allison Rd
- 915 Jackson Place
- 923 Jackson Place
- 911 Jackson Place
- 925 Jackson Place
- 932 Northgate Dr
- 936 Northgate Dr
- 940 Northgate Dr
- 928 Northgate Dr
- 907 Jackson Place
- 929 Jackson Place
- 916 Jackson Place
- 942 Northgate Dr
- 910 Jackson Place
- 920 Jackson Place
- 924 Northgate Dr
- 933 Jackson Place
- 924 Jackson Place
- 906 Jackson Place
- 918 Northgate Dr
- 726 Northgate Dr
Your Personal Tour Guide
Ask me questions while you tour the home.