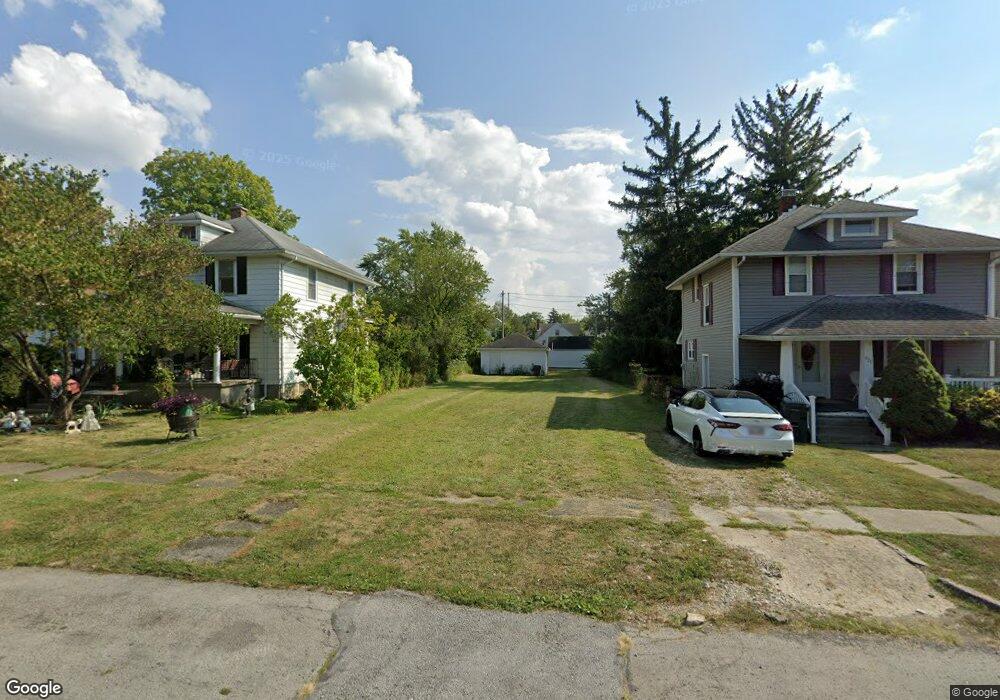
919 Leland Ave Lima, OH 45805
Central Lima NeighborhoodEstimated Value: $61,000 - $89,000
4
Beds
2
Baths
2,232
Sq Ft
$31/Sq Ft
Est. Value
About This Home
This home is located at 919 Leland Ave, Lima, OH 45805 and is currently estimated at $69,173, approximately $30 per square foot. 919 Leland Ave is a home located in Allen County with nearby schools including Heritage Elementary School, Lima North Middle School, and Lima West Middle School.
Ownership History
Date
Name
Owned For
Owner Type
Purchase Details
Closed on
Sep 22, 2020
Sold by
Bowman Colby D and Bowman Lana J
Bought by
Daley Donald G
Current Estimated Value
Purchase Details
Closed on
Aug 8, 2017
Sold by
County Of Allen
Bought by
Bowman Colby D and Bowman Lana J
Purchase Details
Closed on
Oct 10, 2007
Sold by
Us Bank Na
Bought by
Myers Kevin J and Myers Esther M
Purchase Details
Closed on
Jun 26, 2002
Sold by
Trst Thomas Charlton
Bought by
Fyffe Bobby
Home Financials for this Owner
Home Financials are based on the most recent Mortgage that was taken out on this home.
Original Mortgage
$46,500
Interest Rate
10.2%
Mortgage Type
New Conventional
Purchase Details
Closed on
Aug 31, 1989
Bought by
Stevenson Doug
Create a Home Valuation Report for This Property
The Home Valuation Report is an in-depth analysis detailing your home's value as well as a comparison with similar homes in the area
Home Values in the Area
Average Home Value in this Area
Purchase History
| Date | Buyer | Sale Price | Title Company |
|---|---|---|---|
| Daley Donald G | $29,500 | None Available | |
| Daley Donald G | -- | Daley Douglas A | |
| Bowman Colby D | $9,481 | None Available | |
| Myers Kevin J | $18,700 | Chicago Title Insurance Co | |
| Fyffe Bobby | $62,000 | -- | |
| Stevenson Doug | $31,000 | -- |
Source: Public Records
Mortgage History
| Date | Status | Borrower | Loan Amount |
|---|---|---|---|
| Previous Owner | Fyffe Bobby | $46,500 |
Source: Public Records
Tax History Compared to Growth
Tax History
| Year | Tax Paid | Tax Assessment Tax Assessment Total Assessment is a certain percentage of the fair market value that is determined by local assessors to be the total taxable value of land and additions on the property. | Land | Improvement |
|---|---|---|---|---|
| 2024 | $153 | $2,420 | $1,960 | $460 |
| 2023 | $153 | $2,110 | $1,720 | $390 |
| 2022 | $151 | $2,110 | $1,720 | $390 |
| 2021 | $1,082 | $23,700 | $2,140 | $21,560 |
| 2020 | $1,106 | $21,500 | $2,070 | $19,430 |
| 2019 | $1,106 | $21,500 | $2,070 | $19,430 |
| 2018 | $1,102 | $21,500 | $2,070 | $19,430 |
| 2017 | $1,130 | $21,500 | $2,070 | $19,430 |
| 2016 | $2,183 | $21,290 | $2,070 | $19,220 |
| 2015 | $1,140 | $21,290 | $2,070 | $19,220 |
| 2014 | $1,149 | $21,630 | $2,170 | $19,460 |
| 2013 | $1,119 | $21,630 | $2,170 | $19,460 |
Source: Public Records
Map
Nearby Homes
- 618 Woodward Ave
- 1023 Leland Ave
- 648 Hazel Ave
- 631 Hazel Ave
- 638 Hazel Ave
- 1120 Richie Ave
- 676 Cortlandt Ave
- 1206 Rice Ave
- 576 Cortlandt Ave
- 745 Brice Ave
- 708 N Metcalf St
- 612 N Metcalf St
- 1036 W High St
- 1116 Belvidere Ave
- 627 Brice Ave
- 434 N Washington St
- 416 Hazel Ave
- 849 Runyan Ave
- 0 Sherman Ave
- 325 N McDonel St