Estimated Value: $735,943 - $870,000
4
Beds
4
Baths
4,372
Sq Ft
$181/Sq Ft
Est. Value
About This Home
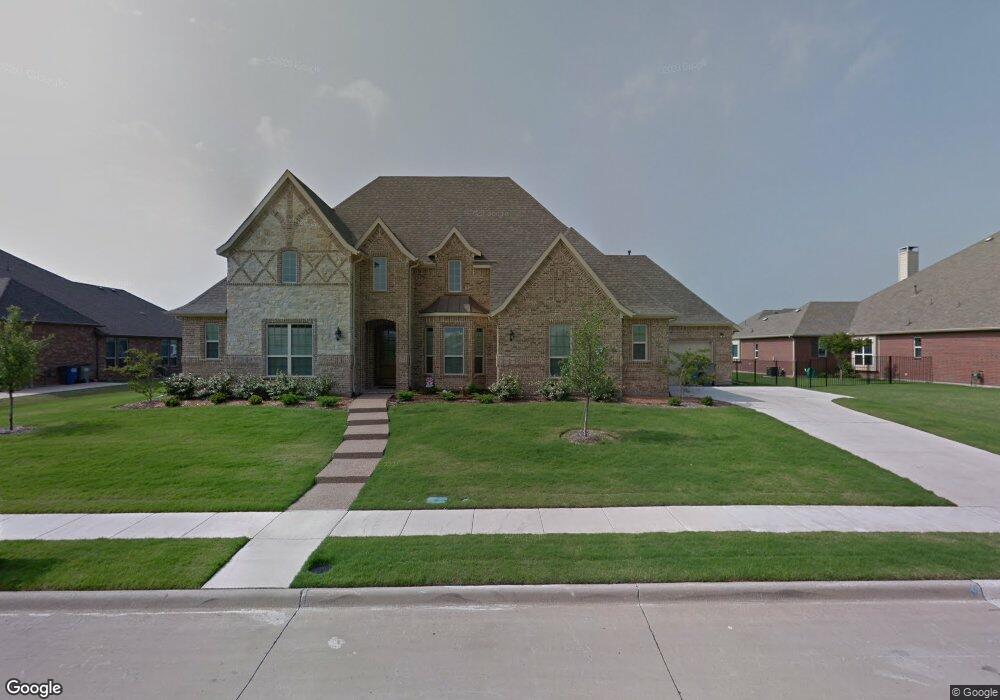
This home is located at 919 Lorene Dr, Wylie, TX 75098 and is currently estimated at $791,736, approximately $181 per square foot. 919 Lorene Dr is a home located in Collin County with nearby schools including Wally Watkins Elementary School, AB Harrison Intermediate School, and Grady Burnett J High School.
Ownership History
Date
Name
Owned For
Owner Type
Purchase Details
Closed on
Jun 25, 2018
Sold by
Ward Johnny L and Ward Patricia
Bought by
Ford Kyle
Current Estimated Value
Home Financials for this Owner
Home Financials are based on the most recent Mortgage that was taken out on this home.
Original Mortgage
$360,000
Outstanding Balance
$311,340
Interest Rate
4.5%
Mortgage Type
New Conventional
Estimated Equity
$480,396
Purchase Details
Closed on
Jun 15, 2012
Sold by
Paul Taylor Homes Limited
Bought by
Ward Johnny L and Ward Patricia
Home Financials for this Owner
Home Financials are based on the most recent Mortgage that was taken out on this home.
Original Mortgage
$270,000
Interest Rate
3.8%
Mortgage Type
New Conventional
Purchase Details
Closed on
Oct 14, 2011
Sold by
Collins Estate Llc
Bought by
Paul Taylor Home Limited
Create a Home Valuation Report for This Property
The Home Valuation Report is an in-depth analysis detailing your home's value as well as a comparison with similar homes in the area
Home Values in the Area
Average Home Value in this Area
Purchase History
| Date | Buyer | Sale Price | Title Company |
|---|---|---|---|
| Ford Kyle | -- | None Available | |
| Ward Johnny L | -- | Benchmark Title Services Llc | |
| Paul Taylor Home Limited | -- | None Available |
Source: Public Records
Mortgage History
| Date | Status | Borrower | Loan Amount |
|---|---|---|---|
| Open | Ford Kyle | $360,000 | |
| Previous Owner | Ward Johnny L | $270,000 |
Source: Public Records
Tax History Compared to Growth
Tax History
| Year | Tax Paid | Tax Assessment Tax Assessment Total Assessment is a certain percentage of the fair market value that is determined by local assessors to be the total taxable value of land and additions on the property. | Land | Improvement |
|---|---|---|---|---|
| 2025 | $12,879 | $794,200 | $190,000 | $648,913 |
| 2024 | $12,879 | $724,730 | $190,000 | $532,000 |
| 2023 | $12,879 | $658,845 | $150,000 | $653,024 |
| 2022 | $13,140 | $598,950 | $150,000 | $593,323 |
| 2021 | $12,811 | $547,408 | $140,000 | $407,408 |
| 2020 | $12,291 | $512,055 | $100,000 | $412,055 |
| 2019 | $11,825 | $450,000 | $100,000 | $350,000 |
| 2018 | $12,976 | $481,814 | $100,000 | $381,814 |
| 2017 | $11,962 | $444,187 | $80,000 | $364,187 |
| 2016 | $11,753 | $422,997 | $80,000 | $342,997 |
| 2015 | $9,658 | $389,232 | $80,000 | $309,232 |
Source: Public Records
Map
Nearby Homes
- 1210 Iron Horse St
- 800 Twin Oaks Dr
- Oakhaven Plan at Alanis Crossing
- Valencia Plan at Alanis Crossing
- 1201 E Stone Rd
- 1318 Chestnut Hill Dr
- 1321 Iron Horse St
- 314 Lake Texoma Dr
- 1320 Cedar Branch Dr
- 1500 Northwood Dr
- 825 Forest Edge Ln
- 1316 Taren Trail
- 1318 Taren Trail
- 811 Forest Edge Ln
- 306 Foxwood Ct
- 414 Briarwood Dr
- 820 Foxwood Ln
- 416 Dogwood Dr
- 825 Foxwood Ln
- 1323 Canyon Creek Rd