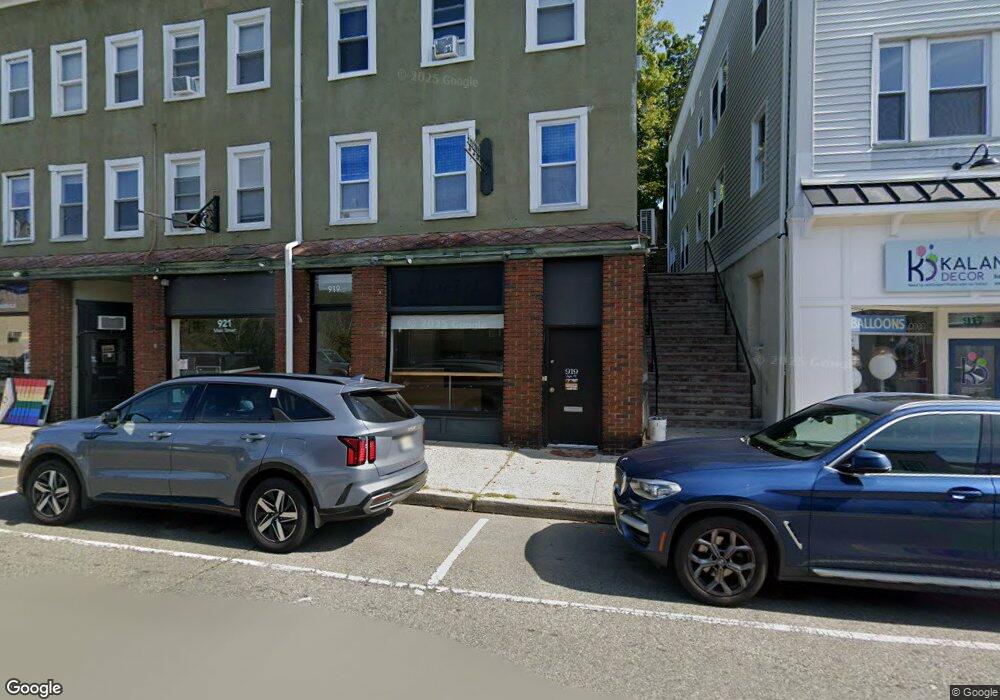
919 Main St Unit 1 Boonton, NJ 07005
Estimated Value: $1,354,792
2
Beds
1
Bath
4,087
Sq Ft
$331/Sq Ft
Est. Value
About This Home
This home is located at 919 Main St Unit 1, Boonton, NJ 07005 and is currently estimated at $1,354,792, approximately $331 per square foot. 919 Main St Unit 1 is a home located in Morris County with nearby schools including School Street Elementary School, John Hill Elementary School, and Boonton High School.
Ownership History
Date
Name
Owned For
Owner Type
Purchase Details
Closed on
Mar 31, 2017
Sold by
Jakk Group Llc
Bought by
A G Son Realty Llc
Current Estimated Value
Home Financials for this Owner
Home Financials are based on the most recent Mortgage that was taken out on this home.
Original Mortgage
$460,000
Interest Rate
3.91%
Mortgage Type
Commercial
Purchase Details
Closed on
Mar 18, 2003
Sold by
Saia Mary
Bought by
Jakk Group Inc
Home Financials for this Owner
Home Financials are based on the most recent Mortgage that was taken out on this home.
Original Mortgage
$415,000
Interest Rate
5.88%
Mortgage Type
Commercial
Create a Home Valuation Report for This Property
The Home Valuation Report is an in-depth analysis detailing your home's value as well as a comparison with similar homes in the area
Home Values in the Area
Average Home Value in this Area
Purchase History
| Date | Buyer | Sale Price | Title Company |
|---|---|---|---|
| A G Son Realty Llc | $800,000 | Passaic Valley Title Svcs In | |
| Jakk Group Inc | $540,000 | -- |
Source: Public Records
Mortgage History
| Date | Status | Borrower | Loan Amount |
|---|---|---|---|
| Previous Owner | A G Son Realty Llc | $460,000 | |
| Previous Owner | Jakk Group Inc | $415,000 |
Source: Public Records
Tax History Compared to Growth
Tax History
| Year | Tax Paid | Tax Assessment Tax Assessment Total Assessment is a certain percentage of the fair market value that is determined by local assessors to be the total taxable value of land and additions on the property. | Land | Improvement |
|---|---|---|---|---|
| 2025 | $15,048 | $445,200 | $229,500 | $215,700 |
| 2024 | $14,652 | $445,200 | $229,500 | $215,700 |
| 2023 | $14,652 | $445,200 | $229,500 | $215,700 |
| 2022 | $13,886 | $445,200 | $229,500 | $215,700 |
| 2021 | $13,886 | $445,200 | $229,500 | $215,700 |
| 2020 | $13,311 | $445,200 | $229,500 | $215,700 |
| 2019 | $13,485 | $445,200 | $229,500 | $215,700 |
| 2018 | $13,129 | $445,200 | $229,500 | $215,700 |
| 2017 | $12,581 | $445,200 | $229,500 | $215,700 |
| 2016 | $12,252 | $445,200 | $229,500 | $215,700 |
| 2015 | $12,052 | $445,200 | $229,500 | $215,700 |
| 2014 | $11,784 | $445,200 | $229,500 | $215,700 |
Source: Public Records
Map
Nearby Homes