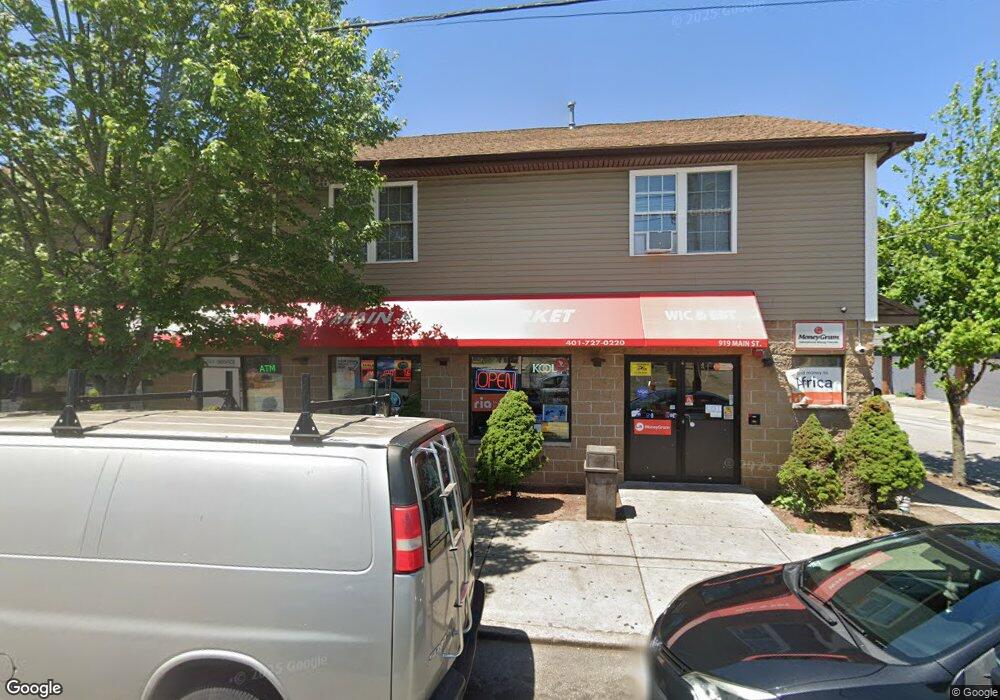
919 Main St Pawtucket, RI 02860
Woodlawn Neighborhood
6
Beds
2
Baths
5,120
Sq Ft
8,015
Sq Ft Lot
About This Home
This home is located at 919 Main St, Pawtucket, RI 02860. 919 Main St is a home located in Providence County with nearby schools including International Charter School, Blackstone Valley Prep Junior High School, and Blackstone Academy Charter School.
Ownership History
Date
Name
Owned For
Owner Type
Purchase Details
Closed on
Dec 18, 2017
Sold by
Frias Jose R and Frias Carmelo
Bought by
Frias Reatly Llc
Purchase Details
Closed on
May 9, 2003
Sold by
Pawtucket Dev Agency
Bought by
Frias Jose R
Create a Home Valuation Report for This Property
The Home Valuation Report is an in-depth analysis detailing your home's value as well as a comparison with similar homes in the area
Home Values in the Area
Average Home Value in this Area
Purchase History
| Date | Buyer | Sale Price | Title Company |
|---|---|---|---|
| Frias Reatly Llc | -- | -- | |
| Frias Reatly Llc | -- | -- | |
| Frias Jose R | $17,000 | -- | |
| Frias Jose R | $17,000 | -- |
Source: Public Records
Tax History
| Year | Tax Paid | Tax Assessment Tax Assessment Total Assessment is a certain percentage of the fair market value that is determined by local assessors to be the total taxable value of land and additions on the property. | Land | Improvement |
|---|---|---|---|---|
| 2025 | $5,929 | $450,900 | $92,200 | $358,700 |
| 2024 | -- | $450,900 | $92,200 | $358,700 |
| 2023 | $0 | $350,300 | $76,600 | $273,700 |
| 2022 | $0 | $350,300 | $76,600 | $273,700 |
| 2021 | $0 | $350,300 | $76,600 | $273,700 |
| 2020 | $0 | $319,800 | $76,600 | $243,200 |
| 2019 | $8,852 | $319,800 | $76,600 | $243,200 |
| 2018 | $0 | $319,800 | $76,600 | $243,200 |
| 2017 | $0 | $344,000 | $79,800 | $264,200 |
| 2016 | -- | $344,000 | $79,800 | $264,200 |
| 2015 | -- | $344,000 | $79,800 | $264,200 |
| 2014 | -- | $388,100 | $86,700 | $301,400 |
Source: Public Records
Map
Nearby Homes
- 187 Sisson St
- 11 Sherman St
- 0 Webb St Unit 1406927
- 0 Webb St Unit 73489835
- 126 Dunnell Ave
- 159 Dunnell Ave
- 41 Campbell Terrace
- 18 Dunnell Ave
- 35 Hurley Ave
- 54 Jefferson Ave
- 50 Jefferson Ave
- 76 Slater St
- 107 Mulberry St
- 193 Harrison St
- 32 Carver St
- 167 George St
- 75 Baldwin St
- 59 West Ave
- 122 Lowden St
- 48 Star St
Your Personal Tour Guide
Ask me questions while you tour the home.