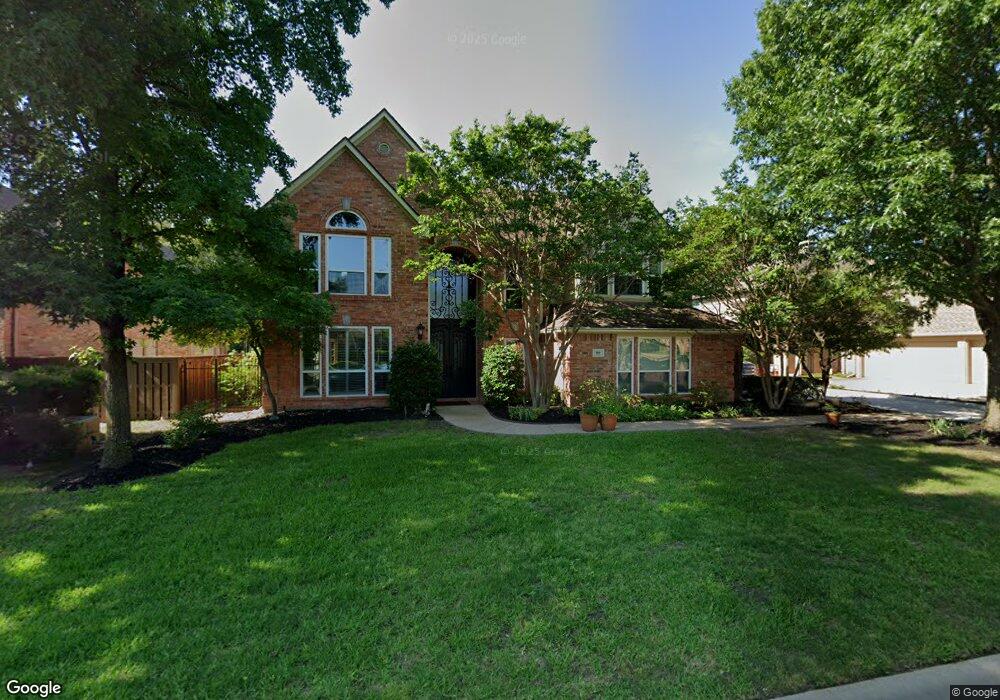
919 Midland Creek Dr Southlake, TX 76092
Estimated Value: $966,000 - $1,184,000
4
Beds
3
Baths
3,571
Sq Ft
$294/Sq Ft
Est. Value
About This Home
This home is located at 919 Midland Creek Dr, Southlake, TX 76092 and is currently estimated at $1,051,079, approximately $294 per square foot. 919 Midland Creek Dr is a home located in Tarrant County with nearby schools including Robert High Rockenbaugh Elementary School, Eubanks Intermediate School, and George Dawson Middle School.
Ownership History
Date
Name
Owned For
Owner Type
Purchase Details
Closed on
May 27, 2005
Sold by
Ahmuty Robert and Ahmuty Sara Miller
Bought by
Dean Steven G and Dean Petra E
Current Estimated Value
Home Financials for this Owner
Home Financials are based on the most recent Mortgage that was taken out on this home.
Original Mortgage
$395,000
Outstanding Balance
$205,018
Interest Rate
5.67%
Mortgage Type
Purchase Money Mortgage
Estimated Equity
$846,061
Purchase Details
Closed on
Oct 6, 1994
Sold by
Weekley Homes Inc
Bought by
Ahmuty Robert and Ahmuty Sara Miller
Home Financials for this Owner
Home Financials are based on the most recent Mortgage that was taken out on this home.
Original Mortgage
$170,000
Interest Rate
8.5%
Create a Home Valuation Report for This Property
The Home Valuation Report is an in-depth analysis detailing your home's value as well as a comparison with similar homes in the area
Home Values in the Area
Average Home Value in this Area
Purchase History
| Date | Buyer | Sale Price | Title Company |
|---|---|---|---|
| Dean Steven G | -- | -- | |
| Ahmuty Robert | -- | Stewart Title |
Source: Public Records
Mortgage History
| Date | Status | Borrower | Loan Amount |
|---|---|---|---|
| Open | Dean Steven G | $395,000 | |
| Previous Owner | Ahmuty Robert | $170,000 |
Source: Public Records
Tax History Compared to Growth
Tax History
| Year | Tax Paid | Tax Assessment Tax Assessment Total Assessment is a certain percentage of the fair market value that is determined by local assessors to be the total taxable value of land and additions on the property. | Land | Improvement |
|---|---|---|---|---|
| 2025 | $2,729 | $877,952 | $175,000 | $702,952 |
| 2024 | $2,729 | $877,952 | $175,000 | $702,952 |
| 2023 | $12,448 | $828,000 | $175,000 | $653,000 |
| 2022 | $13,394 | $713,288 | $150,000 | $563,288 |
| 2021 | $12,869 | $564,420 | $150,000 | $414,420 |
| 2020 | $12,974 | $564,420 | $150,000 | $414,420 |
| 2019 | $13,667 | $564,420 | $150,000 | $414,420 |
| 2018 | $9,789 | $539,020 | $105,000 | $434,020 |
| 2017 | $13,073 | $527,440 | $105,000 | $422,440 |
| 2016 | $12,398 | $500,857 | $105,000 | $395,857 |
| 2015 | $9,760 | $488,396 | $85,000 | $403,396 |
| 2014 | $9,760 | $413,400 | $55,000 | $358,400 |
Source: Public Records
Map
Nearby Homes
- 710 Longford Dr
- 708 Nettleton Dr
- 1100 La Paloma Ct
- 712 Ashleigh Ln
- 1012 Cool River Dr
- 1227 Strathmore Dr
- 608 Regency Crossing
- 1420 Kensington Ct
- 1401 Chardonnay Ct
- 221 Pine Dr
- 521 Regency Crossing
- 351 S White Chapel Blvd
- 702 Sussex Ct
- 1032 Rosavine Dr
- 1028 Rosavine Dr
- 1017 Rosavine Dr
- 1004 Rosavine Dr
- 1020 Rosavine Dr
- 1012 Rosavine Dr
- 1024 Rosavine Dr
- 917 Midland Creek Dr
- 921 Midland Creek Dr
- 915 Midland Creek Dr
- 923 Midland Creek Dr
- 916 Midland Creek Dr
- 922 Midland Creek Dr
- 708 Longford Dr
- 712 Longford Dr
- 913 Midland Creek Dr
- 925 Midland Creek Dr
- 914 Midland Creek Dr
- 924 Midland Creek Dr
- 706 Longford Dr
- 902 Nettleton Ct
- 714 Longford Dr
- 911 Midland Creek Dr
- 927 Midland Creek Dr
- 912 Midland Creek Dr
- 903 Nettleton Ct
- 713 Nettleton Dr