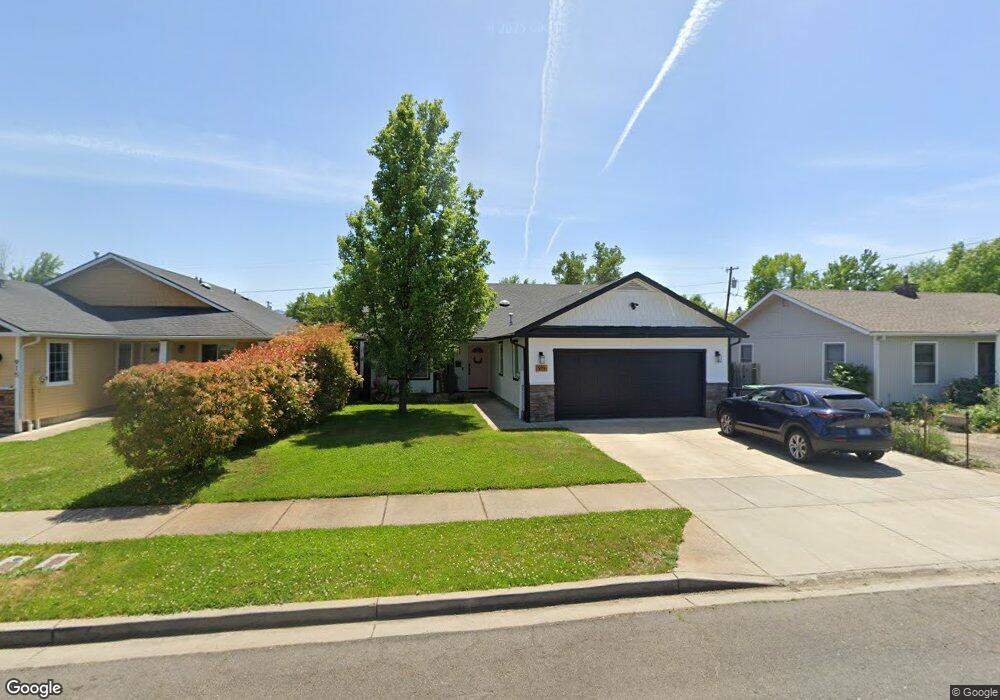
919 Murray St Medford, OR 97501
Washington NeighborhoodEstimated Value: $364,075 - $382,000
3
Beds
2
Baths
1,441
Sq Ft
$258/Sq Ft
Est. Value
About This Home
This home is located at 919 Murray St, Medford, OR 97501 and is currently estimated at $372,269, approximately $258 per square foot. 919 Murray St is a home located in Jackson County with nearby schools including Washington Elementary School, McLoughlin Middle School, and South Medford High School.
Ownership History
Date
Name
Owned For
Owner Type
Purchase Details
Closed on
Jun 10, 2020
Sold by
Flores Jose
Bought by
Johnson Hunter James
Current Estimated Value
Home Financials for this Owner
Home Financials are based on the most recent Mortgage that was taken out on this home.
Original Mortgage
$270,000
Outstanding Balance
$239,334
Interest Rate
3.2%
Mortgage Type
New Conventional
Estimated Equity
$132,935
Purchase Details
Closed on
Jun 25, 2012
Sold by
Federal Home Loan Mortgage Corporation
Bought by
Flores Jose
Home Financials for this Owner
Home Financials are based on the most recent Mortgage that was taken out on this home.
Original Mortgage
$126,564
Interest Rate
3.65%
Mortgage Type
New Conventional
Purchase Details
Closed on
Dec 1, 2011
Sold by
Cascarina Haley H
Bought by
Federal Home Loan Mortgage Corporation
Purchase Details
Closed on
Nov 28, 2006
Sold by
Rogue Development Llc
Bought by
Cascarina Haley H
Home Financials for this Owner
Home Financials are based on the most recent Mortgage that was taken out on this home.
Original Mortgage
$204,800
Interest Rate
6.37%
Mortgage Type
Purchase Money Mortgage
Create a Home Valuation Report for This Property
The Home Valuation Report is an in-depth analysis detailing your home's value as well as a comparison with similar homes in the area
Home Values in the Area
Average Home Value in this Area
Purchase History
| Date | Buyer | Sale Price | Title Company |
|---|---|---|---|
| Johnson Hunter James | $270,000 | Ticor Title | |
| Flores Jose | $128,900 | Evergreen Land Title Company | |
| Federal Home Loan Mortgage Corporation | $125,000 | None Available | |
| Cascarina Haley H | $256,000 | Amerititle |
Source: Public Records
Mortgage History
| Date | Status | Borrower | Loan Amount |
|---|---|---|---|
| Open | Johnson Hunter James | $270,000 | |
| Previous Owner | Flores Jose | $126,564 | |
| Previous Owner | Cascarina Haley H | $204,800 |
Source: Public Records
Tax History Compared to Growth
Tax History
| Year | Tax Paid | Tax Assessment Tax Assessment Total Assessment is a certain percentage of the fair market value that is determined by local assessors to be the total taxable value of land and additions on the property. | Land | Improvement |
|---|---|---|---|---|
| 2025 | $2,432 | $199,280 | $118,350 | $80,930 |
| 2024 | $2,432 | $193,480 | $114,910 | $78,570 |
| 2023 | $2,358 | $187,850 | $111,560 | $76,290 |
| 2022 | $2,300 | $187,850 | $111,560 | $76,290 |
| 2021 | $2,241 | $182,380 | $108,300 | $74,080 |
| 2020 | $2,194 | $177,070 | $105,150 | $71,920 |
| 2019 | $2,800 | $166,920 | $99,110 | $67,810 |
| 2018 | $2,510 | $162,060 | $96,230 | $65,830 |
| 2017 | $2,493 | $162,060 | $96,230 | $65,830 |
| 2016 | $2,740 | $152,760 | $90,710 | $62,050 |
| 2015 | $2,502 | $152,760 | $90,710 | $62,050 |
| 2014 | $2,314 | $144,000 | $85,510 | $58,490 |
Source: Public Records
Map
Nearby Homes
- 708 S Peach St
- 947 Murray Ave
- 949 Murray Ave
- 710 Beekman Ave
- 838 Dakota Ave
- 832 Dakota Ave
- 820 Newtown St
- 506 S Peach St
- 0 N Pacific Hwy Tract B Unit 102984637
- 854 W Stewart Ave Unit 1 & 2
- 534 Hamilton St
- 719 Newtown St
- 810 Grant Ave
- 0 Beekman Unit 1288
- 517 Newtown St
- 801 Grant Ave
- 1036 W 12th St
- 917 Grant Ave
- 1201 Kelly St
- 1217 Murray Ave