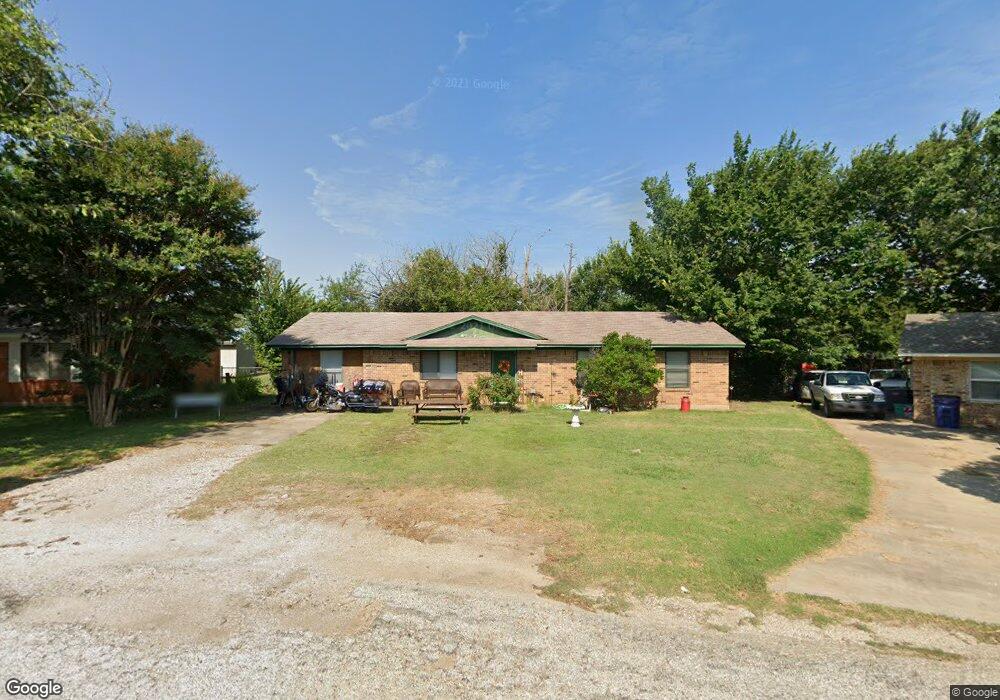
919 N 8th St Sanger, TX 76266
Estimated Value: $185,661 - $251,000
3
Beds
1
Bath
1,125
Sq Ft
$196/Sq Ft
Est. Value
About This Home
This home is located at 919 N 8th St, Sanger, TX 76266 and is currently estimated at $220,415, approximately $195 per square foot. 919 N 8th St is a home located in Denton County with nearby schools including Chisholm Trail Elementary School, Clear Creek Intermediate School, and Sanger Sixth Grade Campus.
Ownership History
Date
Name
Owned For
Owner Type
Purchase Details
Closed on
Jun 25, 2009
Sold by
Holley Billie M
Bought by
Mach Eric J
Current Estimated Value
Home Financials for this Owner
Home Financials are based on the most recent Mortgage that was taken out on this home.
Original Mortgage
$52,820
Interest Rate
5.12%
Mortgage Type
Purchase Money Mortgage
Purchase Details
Closed on
Oct 27, 1999
Sold by
Compton Patricia Dianne Arnett
Bought by
Holley Billie M
Home Financials for this Owner
Home Financials are based on the most recent Mortgage that was taken out on this home.
Original Mortgage
$52,040
Interest Rate
7.77%
Mortgage Type
FHA
Create a Home Valuation Report for This Property
The Home Valuation Report is an in-depth analysis detailing your home's value as well as a comparison with similar homes in the area
Home Values in the Area
Average Home Value in this Area
Purchase History
| Date | Buyer | Sale Price | Title Company |
|---|---|---|---|
| Mach Eric J | -- | None Available | |
| Holley Billie M | -- | -- | |
| Holley Billie M | -- | -- |
Source: Public Records
Mortgage History
| Date | Status | Borrower | Loan Amount |
|---|---|---|---|
| Previous Owner | Mach Eric J | $52,820 | |
| Previous Owner | Holley Billie M | $52,040 |
Source: Public Records
Tax History
| Year | Tax Paid | Tax Assessment Tax Assessment Total Assessment is a certain percentage of the fair market value that is determined by local assessors to be the total taxable value of land and additions on the property. | Land | Improvement |
|---|---|---|---|---|
| 2025 | $2,809 | $138,150 | $74,250 | $63,900 |
| 2024 | $2,809 | $139,000 | $74,250 | $64,750 |
| 2023 | $2,736 | $135,000 | $57,750 | $77,250 |
| 2022 | $2,994 | $135,000 | $52,250 | $82,750 |
| 2021 | $2,428 | $115,507 | $38,475 | $77,032 |
| 2020 | $2,058 | $93,000 | $42,750 | $50,250 |
| 2019 | $2,117 | $93,000 | $42,750 | $50,250 |
| 2018 | $1,923 | $84,000 | $42,750 | $41,250 |
| 2017 | $1,989 | $86,470 | $42,750 | $43,720 |
| 2016 | $1,311 | $57,000 | $23,750 | $33,250 |
| 2015 | -- | $57,000 | $23,750 | $33,250 |
| 2013 | -- | $57,000 | $23,750 | $33,250 |
Source: Public Records
Map
Nearby Homes
- Tbd I-35
- 4551 Farm To Market Road 455
- 2164 Farm To Market Road 455
- 4063 Farm To Market 455 W
- 902 Plum St
- 612 N 10th St
- 2300
- 1149 Serendipity Cir
- 1209 Bolivar St
- 411 Hughes St
- 20 Grouse Cir
- 928 W Willow St
- 8 Grouse Cir
- 710 W Willow St
- 6 Grouse Cir
- 500 W Willow St
- 5 Grouse Cir
- 126 Creekside Dr
- 136 Creekside Dr
- Dogwood Plan at Sable Creek
Your Personal Tour Guide
Ask me questions while you tour the home.