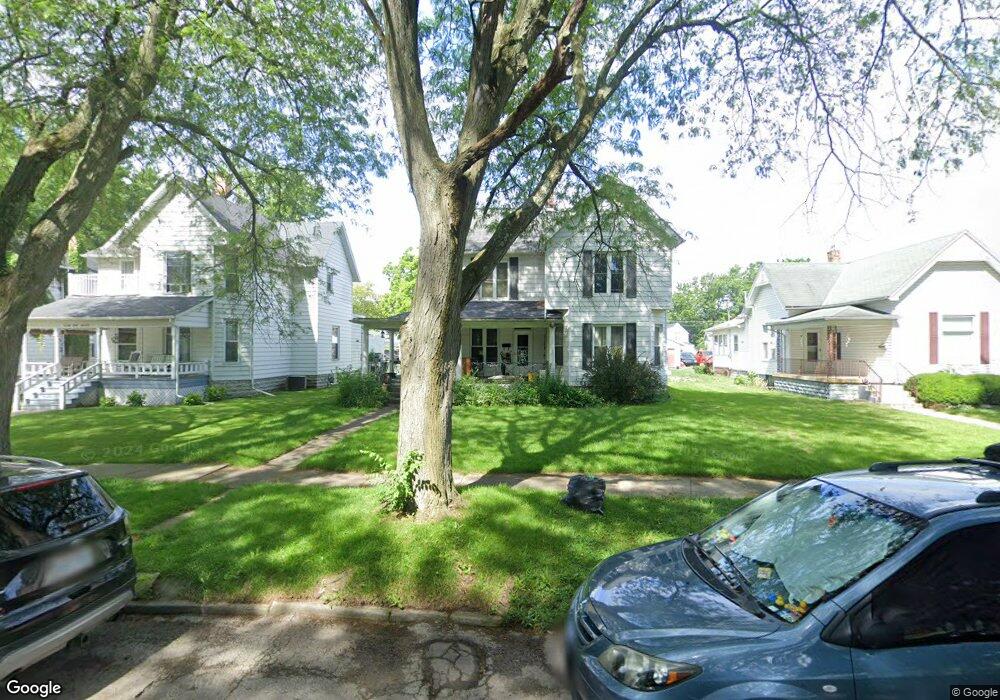
919 N Main St Fostoria, OH 44830
Estimated Value: $189,000 - $202,000
4
Beds
2
Baths
2,177
Sq Ft
$89/Sq Ft
Est. Value
About This Home
This home is located at 919 N Main St, Fostoria, OH 44830 and is currently estimated at $194,289, approximately $89 per square foot. 919 N Main St is a home located in Seneca County with nearby schools including Fostoria Intermediate Elementary School and Fostoria Junior/Senior High School.
Ownership History
Date
Name
Owned For
Owner Type
Purchase Details
Closed on
May 26, 2005
Sold by
Duvall Tereasa M and Flinders Tereasa M
Bought by
Aufdencamp Amie Jo and Clouse Christopher M
Current Estimated Value
Home Financials for this Owner
Home Financials are based on the most recent Mortgage that was taken out on this home.
Original Mortgage
$74,400
Outstanding Balance
$39,216
Interest Rate
5.91%
Mortgage Type
Purchase Money Mortgage
Estimated Equity
$155,073
Purchase Details
Closed on
Nov 28, 2001
Sold by
Flinders Harry L
Bought by
Flinders Tereasa M
Purchase Details
Closed on
May 13, 1999
Sold by
Shumaker Pamela J
Bought by
Flinders Harry L
Purchase Details
Closed on
Apr 2, 1998
Sold by
Bartley Nancy A
Bought by
Shumaker Pamela J
Purchase Details
Closed on
Jul 14, 1992
Sold by
Bartley Rodger L
Bought by
Bartley Nancy A
Purchase Details
Closed on
Jul 1, 1985
Create a Home Valuation Report for This Property
The Home Valuation Report is an in-depth analysis detailing your home's value as well as a comparison with similar homes in the area
Home Values in the Area
Average Home Value in this Area
Purchase History
| Date | Buyer | Sale Price | Title Company |
|---|---|---|---|
| Aufdencamp Amie Jo | $93,000 | None Available | |
| Flinders Tereasa M | -- | -- | |
| Flinders Harry L | $65,000 | -- | |
| Shumaker Pamela J | $62,500 | -- | |
| Bartley Nancy A | -- | -- | |
| -- | $35,000 | -- |
Source: Public Records
Mortgage History
| Date | Status | Borrower | Loan Amount |
|---|---|---|---|
| Open | Aufdencamp Amie Jo | $74,400 |
Source: Public Records
Tax History Compared to Growth
Tax History
| Year | Tax Paid | Tax Assessment Tax Assessment Total Assessment is a certain percentage of the fair market value that is determined by local assessors to be the total taxable value of land and additions on the property. | Land | Improvement |
|---|---|---|---|---|
| 2024 | $2,302 | $45,630 | $4,990 | $40,640 |
| 2023 | $2,306 | $45,630 | $4,990 | $40,640 |
| 2022 | $1,832 | $32,250 | $4,130 | $28,120 |
| 2021 | $1,871 | $32,250 | $4,130 | $28,120 |
| 2020 | $1,879 | $32,250 | $4,134 | $28,116 |
| 2019 | $1,785 | $30,384 | $3,990 | $26,394 |
| 2018 | $1,820 | $30,384 | $3,990 | $26,394 |
| 2017 | $1,628 | $30,384 | $3,990 | $26,394 |
| 2016 | $1,464 | $27,395 | $4,057 | $23,338 |
| 2015 | $1,439 | $27,395 | $4,057 | $23,338 |
| 2014 | $1,370 | $27,395 | $4,057 | $23,338 |
| 2013 | $1,600 | $29,628 | $4,410 | $25,218 |
Source: Public Records
Map
Nearby Homes
- 931 N Union St
- 633 Maple St
- 900 N Countyline St
- 892 N Countyline St
- 1324 N Union St
- 723 N Union St
- 375 Thomas St
- 540 N Poplar St
- 520 N Union St
- 827 Buckley St
- 220 E High St
- 901 Central Ave
- 711 Circle Dr
- 727 Eisenhower Dr
- 203 N Union St
- 481 Beverly Dr
- 509 College Ave
- 412 E Center St
- 0 W South Route 12
- 348 W South St