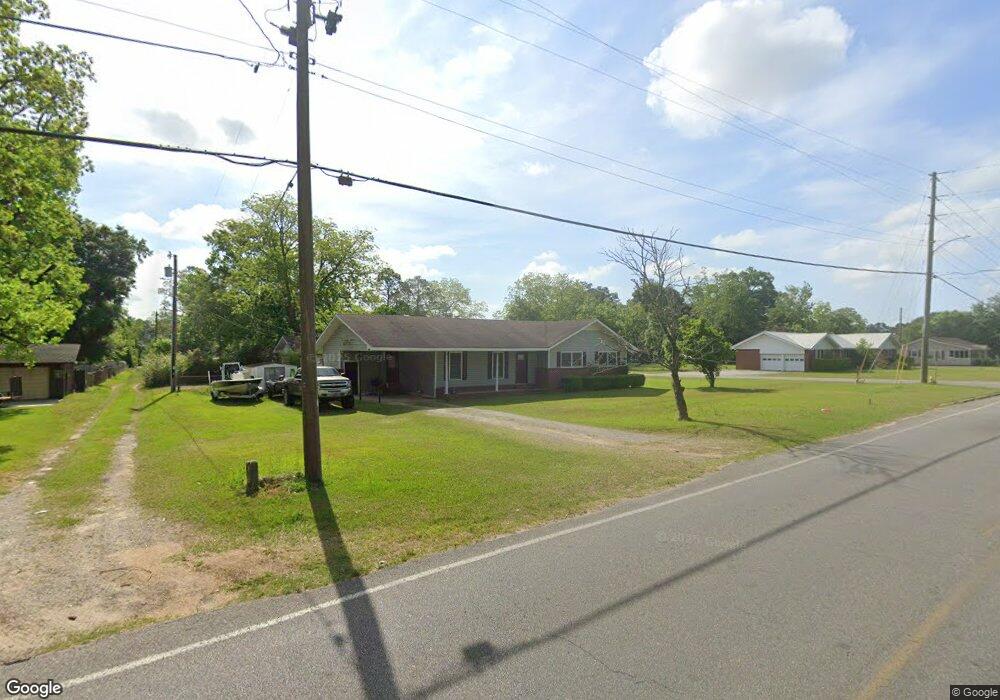
919 N Merrimac Drive Extension Fitzgerald, GA 31750
Estimated Value: $115,000 - $167,000
3
Beds
2
Baths
1,516
Sq Ft
$89/Sq Ft
Est. Value
About This Home
This home is located at 919 N Merrimac Drive Extension, Fitzgerald, GA 31750 and is currently estimated at $135,140, approximately $89 per square foot. 919 N Merrimac Drive Extension is a home located in Ben Hill County with nearby schools including Ben Hill County Primary School, Ben Hill Elementary School, and Ben Hill County Middle School.
Ownership History
Date
Name
Owned For
Owner Type
Purchase Details
Closed on
Oct 13, 2020
Sold by
Dean Cynthia W
Bought by
E Harper Investments Llc
Current Estimated Value
Purchase Details
Closed on
Sep 24, 2015
Sold by
Dean Cynthia W
Bought by
Dean Cynthia W and Dean Bobby
Home Financials for this Owner
Home Financials are based on the most recent Mortgage that was taken out on this home.
Original Mortgage
$120,000
Interest Rate
3.88%
Mortgage Type
FHA
Purchase Details
Closed on
Oct 1, 2010
Sold by
Eastridge Tommie L
Bought by
Dean Cynthia W
Purchase Details
Closed on
Nov 15, 2008
Sold by
Boyette Loyd F Mr
Bought by
Eastridge Cynthia and Eastridge Tommie
Purchase Details
Closed on
Sep 17, 1984
Bought by
Boyette Loyd F Mr
Create a Home Valuation Report for This Property
The Home Valuation Report is an in-depth analysis detailing your home's value as well as a comparison with similar homes in the area
Home Values in the Area
Average Home Value in this Area
Purchase History
| Date | Buyer | Sale Price | Title Company |
|---|---|---|---|
| E Harper Investments Llc | $70,000 | -- | |
| Dean Cynthia W | -- | -- | |
| Dean Cynthia W | -- | -- | |
| Dean Cynthia W | -- | -- | |
| Eastridge Cynthia | -- | -- | |
| Boyette Loyd F Mr | $47,000 | -- |
Source: Public Records
Mortgage History
| Date | Status | Borrower | Loan Amount |
|---|---|---|---|
| Previous Owner | Dean Cynthia W | $120,000 |
Source: Public Records
Tax History Compared to Growth
Tax History
| Year | Tax Paid | Tax Assessment Tax Assessment Total Assessment is a certain percentage of the fair market value that is determined by local assessors to be the total taxable value of land and additions on the property. | Land | Improvement |
|---|---|---|---|---|
| 2024 | $1,701 | $39,878 | $2,400 | $37,478 |
| 2023 | $1,187 | $38,722 | $2,400 | $36,322 |
| 2022 | $1,101 | $33,304 | $2,400 | $30,904 |
| 2021 | $962 | $28,000 | $2,215 | $25,785 |
| 2020 | $565 | $28,257 | $2,400 | $25,857 |
| 2019 | $563 | $28,257 | $2,400 | $25,857 |
| 2018 | $1,212 | $28,119 | $2,400 | $25,719 |
| 2017 | $549 | $27,775 | $2,400 | $25,375 |
| 2016 | $522 | $27,712 | $2,400 | $25,312 |
| 2015 | -- | $27,977 | $2,400 | $25,577 |
| 2014 | -- | $28,506 | $2,400 | $26,106 |
Source: Public Records
Map
Nearby Homes
- 906 N Merrimac Dr
- 123 Blueberry Ln
- 608 W Sultana Dr
- 103 Meadowood Ln
- 141 Turner Ave
- 502 W Alapaha St
- 606 W Suwanee St
- 118 Patton Ave
- 807 W Oconee St
- 115 Easy St
- 303 W Altamaha St
- 616 N Main St
- 109 Pearl Place
- 137 Atlantic Ave
- 613 W Central Ave
- 237 Dewey McGlamry Rd
- 503 N Main St
- 102 Irwinville Hwy
- 118 Irwinville Hwy
- 816 W Central Ave
- 919 N Merrimac Dr
- 139 Northwood Dr
- 925 N Merrimac Dr
- 137 Northwood Dr
- 136 Branch Dr
- 104 Grace Ave
- 136 Northwood Dr
- 912 N Merrimac Dr
- 133 Northwood Dr Unit 1
- 133 Northwood Dr
- 912 N Merrimac Drive Extension
- 103 Grace Ave
- 929 N Merrimac Drive Extension
- 909 N Merrimac Dr
- 132 Northwood Dr
- 910 N Merrimac Dr
- 107 Grace Ave
- 108 9th Ave
- 930 Ext N Merrimac Dr
- 933 N Merrimac Drive Extension