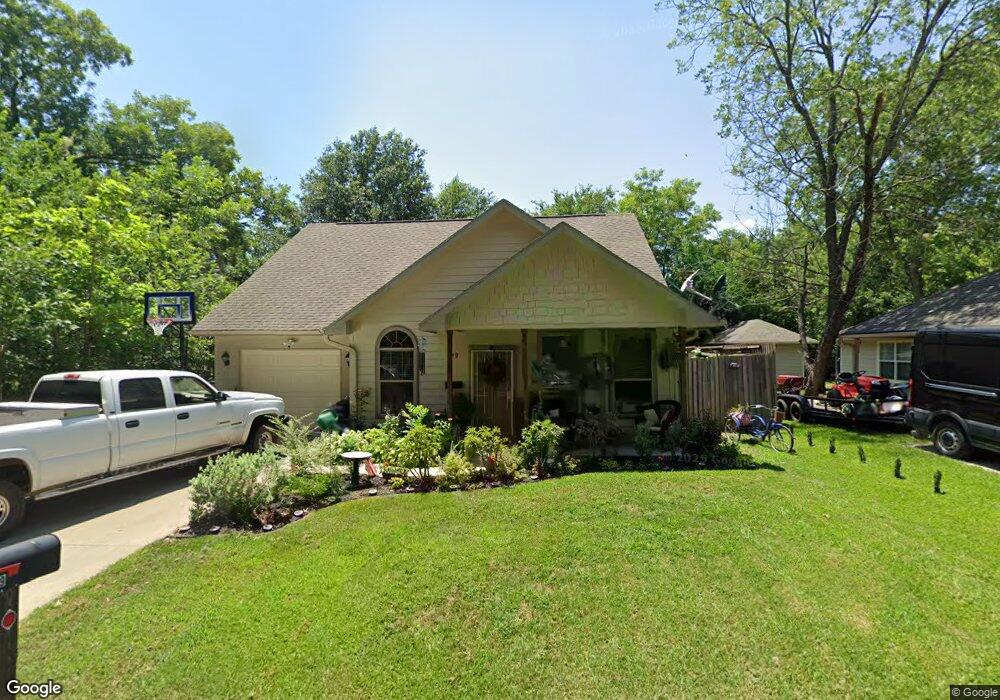
919 Pine St Bonham, TX 75418
Estimated Value: $188,434 - $209,000
Studio
1
Bath
1,152
Sq Ft
$175/Sq Ft
Est. Value
About This Home
This home is located at 919 Pine St, Bonham, TX 75418 and is currently estimated at $201,609, approximately $175 per square foot. 919 Pine St is a home located in Fannin County with nearby schools including Evans Elementary School, Finley-Oates Elementary School, and LH Rather Jr High School.
Ownership History
Date
Name
Owned For
Owner Type
Purchase Details
Closed on
Jun 1, 2023
Sold by
Thomison Julie T
Bought by
Thomison Julie T and Henry Joseph
Current Estimated Value
Purchase Details
Closed on
Mar 31, 2015
Sold by
Diseker Gregory Brent
Bought by
Thompson Julie T
Home Financials for this Owner
Home Financials are based on the most recent Mortgage that was taken out on this home.
Original Mortgage
$93,000
Interest Rate
3.82%
Mortgage Type
Purchase Money Mortgage
Purchase Details
Closed on
Sep 29, 2008
Sold by
Anderson Bruce Edward
Bought by
Diseker Gregory Brent
Home Financials for this Owner
Home Financials are based on the most recent Mortgage that was taken out on this home.
Original Mortgage
$88,798
Interest Rate
6.52%
Create a Home Valuation Report for This Property
The Home Valuation Report is an in-depth analysis detailing your home's value as well as a comparison with similar homes in the area
Purchase History
| Date | Buyer | Sale Price | Title Company |
|---|---|---|---|
| Thomison Julie T | -- | None Listed On Document | |
| Thompson Julie T | -- | None Available | |
| Diseker Gregory Brent | -- | None Available |
Source: Public Records
Mortgage History
| Date | Status | Borrower | Loan Amount |
|---|---|---|---|
| Previous Owner | Thompson Julie T | $93,000 | |
| Previous Owner | Diseker Gregory Brent | $88,798 |
Source: Public Records
Tax History
| Year | Tax Paid | Tax Assessment Tax Assessment Total Assessment is a certain percentage of the fair market value that is determined by local assessors to be the total taxable value of land and additions on the property. | Land | Improvement |
|---|---|---|---|---|
| 2025 | $3,887 | $218,240 | $35,960 | $182,280 |
| 2024 | $35 | $202,500 | $35,780 | $166,720 |
| 2023 | $3,265 | $184,960 | $22,110 | $162,850 |
| 2022 | $3,311 | $173,360 | $16,320 | $157,040 |
| 2021 | $3,459 | $137,980 | $8,470 | $129,510 |
| 2020 | $3,180 | $126,570 | $5,910 | $120,660 |
| 2019 | $3,409 | $128,280 | $5,800 | $122,480 |
| 2018 | $2,729 | $102,830 | $5,740 | $97,090 |
| 2017 | $2,157 | $84,410 | $3,010 | $81,400 |
| 2016 | $1,842 | $72,080 | $3,010 | $69,070 |
| 2015 | -- | $67,000 | $2,900 | $64,100 |
| 2014 | -- | $64,980 | $2,370 | $62,610 |
Source: Public Records
Map
Nearby Homes
Your Personal Tour Guide
Ask me questions while you tour the home.