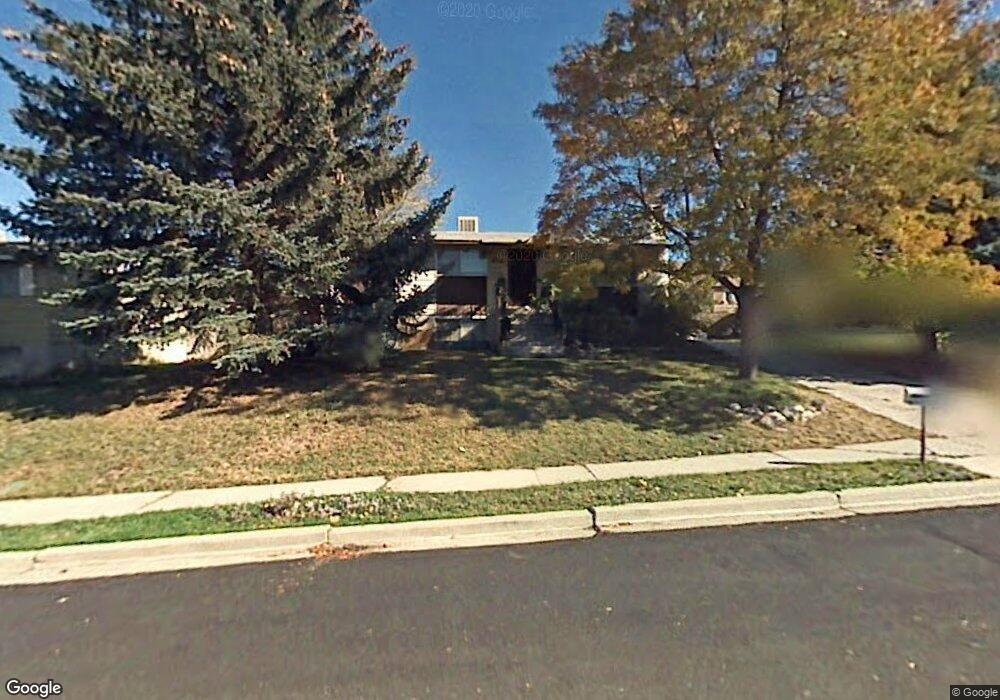
919 S 680 W Payson, UT 84651
Estimated Value: $407,637 - $427,000
3
Beds
1
Bath
1,107
Sq Ft
$379/Sq Ft
Est. Value
About This Home
This home is located at 919 S 680 W, Payson, UT 84651 and is currently estimated at $419,879, approximately $379 per square foot. 919 S 680 W is a home located in Utah County with nearby schools including Wilson Elementary School, Payson Junior High School, and Mt. Nebo Middle.
Ownership History
Date
Name
Owned For
Owner Type
Purchase Details
Closed on
Jul 13, 2021
Sold by
Clendenin Penny and Estate Of Rod Clendenin
Bought by
Clendenin Penny and R & P Clendenin Family Trust
Current Estimated Value
Purchase Details
Closed on
Jul 12, 2021
Sold by
Clendenin Penny and R & P Clendenin Family Trust
Bought by
Clendenin Jordan
Purchase Details
Closed on
Apr 23, 2016
Sold by
Clendenin Jordan
Bought by
Clendenin Rod D
Purchase Details
Closed on
Apr 15, 2016
Sold by
Clendenin Rod D and Clendenin Carol Gene
Bought by
Clendenin Jordan
Create a Home Valuation Report for This Property
The Home Valuation Report is an in-depth analysis detailing your home's value as well as a comparison with similar homes in the area
Home Values in the Area
Average Home Value in this Area
Purchase History
| Date | Buyer | Sale Price | Title Company |
|---|---|---|---|
| Clendenin Penny | -- | None Available | |
| Clendenin Jordan | -- | None Available | |
| Clendenin Rod D | -- | Accommodation | |
| Clendenin Jordan | -- | Accommodation |
Source: Public Records
Tax History
| Year | Tax Paid | Tax Assessment Tax Assessment Total Assessment is a certain percentage of the fair market value that is determined by local assessors to be the total taxable value of land and additions on the property. | Land | Improvement |
|---|---|---|---|---|
| 2025 | $1,846 | $205,755 | -- | -- |
| 2024 | $1,846 | $187,825 | $0 | $0 |
| 2023 | $1,847 | $188,485 | $0 | $0 |
| 2022 | $2,020 | $202,730 | $0 | $0 |
| 2021 | $1,636 | $263,300 | $89,600 | $173,700 |
| 2020 | $1,527 | $240,500 | $77,900 | $162,600 |
| 2019 | $1,374 | $221,800 | $71,100 | $150,700 |
| 2018 | $1,351 | $210,300 | $59,600 | $150,700 |
| 2017 | $1,195 | $99,990 | $0 | $0 |
| 2016 | $1,044 | $86,845 | $0 | $0 |
| 2015 | $912 | $75,295 | $0 | $0 |
| 2014 | $811 | $67,485 | $0 | $0 |
Source: Public Records
Map
Nearby Homes
- 528 W 1150 S
- 846 S 880 W
- 1172 S 880 W
- 626 S 800 W Unit 32
- 533 S 700 W
- 1152 W 1000 S
- 1128 W 1150 S Unit 9
- 1320 S 950 W
- 347 W 1380 S
- 1024 S 1170 W
- 1116 W 1290 S
- 1192 W 1130 St S Unit 202
- 1146 W 1260 S
- 1216 S 1150 W Unit 19
- 1338 S 1050 W
- 802 Brookside Ct
- 588 W 1450 S
- 742 W 400 S
- 1468 S 910 W
- 1463 S 260 W
Your Personal Tour Guide
Ask me questions while you tour the home.