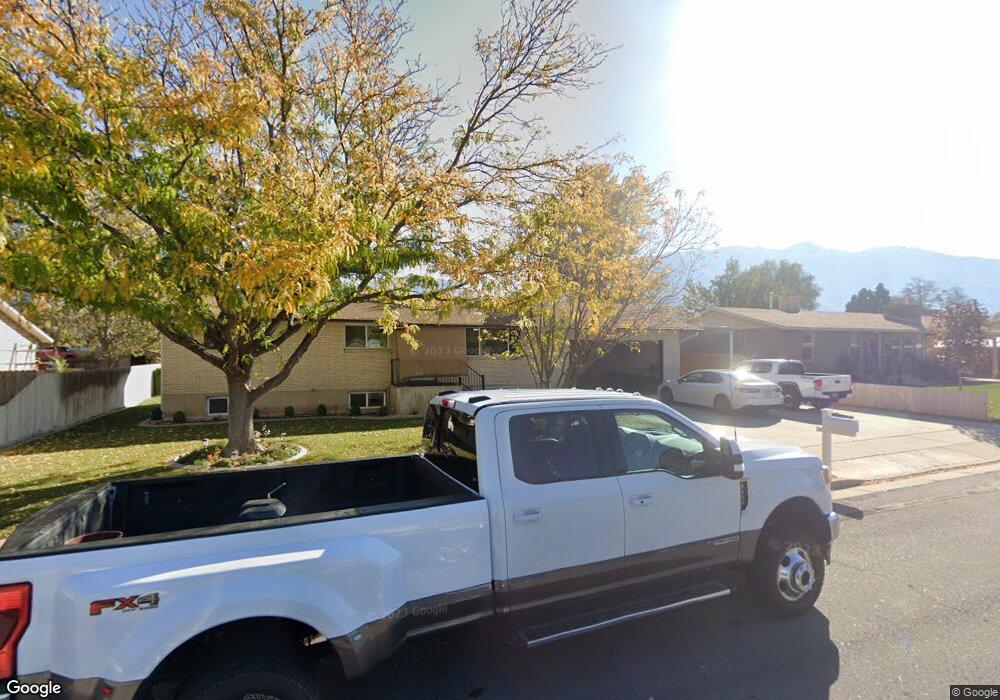
919 S 870 E Springville, UT 84663
East Hobble Creek NeighborhoodEstimated Value: $484,000 - $487,000
5
Beds
2
Baths
2,288
Sq Ft
$212/Sq Ft
Est. Value
About This Home
This home is located at 919 S 870 E, Springville, UT 84663 and is currently estimated at $485,476, approximately $212 per square foot. 919 S 870 E is a home located in Utah County with nearby schools including Sage Creek Elementary, Springville High School, and Springville Junior High School.
Ownership History
Date
Name
Owned For
Owner Type
Purchase Details
Closed on
Jan 11, 2024
Sold by
Snelson Family Trust
Bought by
Messick Ryan and Messick Mele
Current Estimated Value
Home Financials for this Owner
Home Financials are based on the most recent Mortgage that was taken out on this home.
Original Mortgage
$24,070
Outstanding Balance
$23,670
Interest Rate
7.22%
Estimated Equity
$461,806
Purchase Details
Closed on
Oct 28, 2016
Sold by
Snelson Messick Tammy Lou
Bought by
Snelson Collen M
Purchase Details
Closed on
Dec 4, 2015
Sold by
Marshall Cathy Ann Snelson and The Snelson Family Trust
Bought by
Messick Tammy Lou Snelson
Purchase Details
Closed on
Mar 13, 2012
Sold by
Snelson Snelson Terry Lee Terry Lee and Snelson Marshall Cathy Ann
Bought by
Marshall Cathy Ann Snelson and Snelson Family Trust
Purchase Details
Closed on
Jan 27, 2003
Sold by
Snelson Colleen M
Bought by
Snelson Snelson Terry Lee Terry Lee and Snelson Marshall Cathy Ann
Create a Home Valuation Report for This Property
The Home Valuation Report is an in-depth analysis detailing your home's value as well as a comparison with similar homes in the area
Home Values in the Area
Average Home Value in this Area
Purchase History
| Date | Buyer | Sale Price | Title Company |
|---|---|---|---|
| Messick Ryan | -- | Pro Title & Escrow | |
| Snelson Collen M | -- | None Available | |
| Messick Tammy Lou Snelson | -- | Pro Title And Escrow Inc | |
| Marshall Cathy Ann Snelson | -- | None Available | |
| Snelson Snelson Terry Lee Terry Lee | -- | Provo Land Title Company |
Source: Public Records
Mortgage History
| Date | Status | Borrower | Loan Amount |
|---|---|---|---|
| Open | Messick Ryan | $24,070 | |
| Open | Messick Ryan | $451,668 |
Source: Public Records
Tax History
| Year | Tax Paid | Tax Assessment Tax Assessment Total Assessment is a certain percentage of the fair market value that is determined by local assessors to be the total taxable value of land and additions on the property. | Land | Improvement |
|---|---|---|---|---|
| 2025 | $2,168 | $225,940 | -- | -- |
| 2024 | $2,168 | $222,145 | $0 | $0 |
| 2023 | $2,129 | $218,295 | $0 | $0 |
| 2022 | $2,203 | $221,925 | $0 | $0 |
| 2021 | $1,980 | $310,400 | $100,600 | $209,800 |
| 2020 | $1,803 | $274,100 | $74,500 | $199,600 |
| 2019 | $1,694 | $262,100 | $67,400 | $194,700 |
| 2018 | $1,579 | $233,100 | $63,800 | $169,300 |
| 2017 | $1,469 | $115,170 | $0 | $0 |
| 2016 | $1,367 | $105,105 | $0 | $0 |
| 2015 | $1,229 | $96,580 | $0 | $0 |
| 2014 | $1,191 | $92,950 | $0 | $0 |
Source: Public Records
Map
Nearby Homes
- 949 S 1060 E
- 883 E 700 S
- 677 E 800 South St
- 1121 W 1800 N
- 1403 S 625 E
- 645 Swenson Ave Unit 5
- 645 Swenson Ave Unit 3
- 647 Swenson Ave Unit 3
- 579 E 800 St S
- 629 E 800 St S
- 1518 S 600 E
- 802 S Brookside Dr
- 1518 E Pheasant Run Dr
- 942 Sage Creek Cir
- 805 E 400 S
- 445 E 535 S
- 1525 S 400 E Unit 36
- 585 S 400 E
- 1010 S 400 E Unit 39
- 1618 E 970 S
Your Personal Tour Guide
Ask me questions while you tour the home.