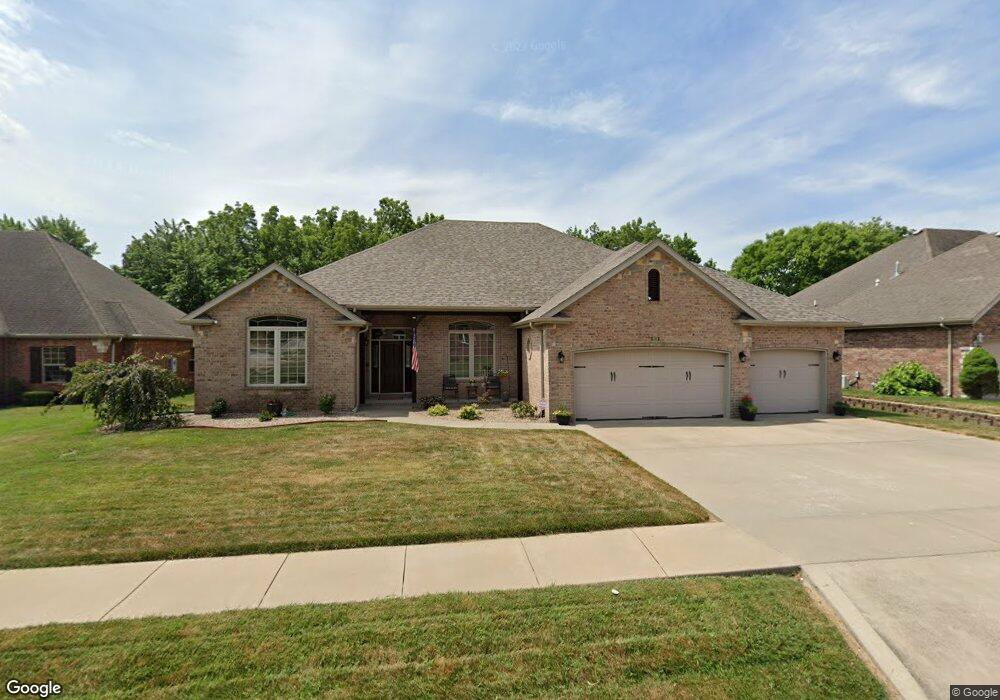
919 S Shuyler St Republic, MO 65738
Estimated Value: $421,414 - $519,000
3
Beds
2
Baths
2,983
Sq Ft
$159/Sq Ft
Est. Value
About This Home
This home is located at 919 S Shuyler St, Republic, MO 65738 and is currently estimated at $474,104, approximately $158 per square foot. 919 S Shuyler St is a home located in Greene County with nearby schools including Lyon Elementary School, Republic Middle School, and Republic High School.
Ownership History
Date
Name
Owned For
Owner Type
Purchase Details
Closed on
Sep 15, 2023
Sold by
Blythe Russell D and Blythe Lesa L
Bought by
Revocable Trust and Blythe
Current Estimated Value
Purchase Details
Closed on
Apr 30, 2008
Sold by
Witten Daniel R and Witten Julie A
Bought by
Blythe Russell D and Blythe Lesa L
Home Financials for this Owner
Home Financials are based on the most recent Mortgage that was taken out on this home.
Original Mortgage
$266,000
Interest Rate
5.84%
Mortgage Type
VA
Purchase Details
Closed on
Jul 27, 2007
Sold by
Petersn Gary E and Peterson Marcella
Bought by
Witten Daniel R and Witten Julie A
Home Financials for this Owner
Home Financials are based on the most recent Mortgage that was taken out on this home.
Original Mortgage
$220,000
Interest Rate
6.71%
Mortgage Type
New Conventional
Purchase Details
Closed on
Nov 18, 2005
Sold by
Valley Park Estates Lc
Bought by
Petterson Gary E and Petterson Marcella
Create a Home Valuation Report for This Property
The Home Valuation Report is an in-depth analysis detailing your home's value as well as a comparison with similar homes in the area
Home Values in the Area
Average Home Value in this Area
Purchase History
| Date | Buyer | Sale Price | Title Company |
|---|---|---|---|
| Revocable Trust | -- | None Listed On Document | |
| Blythe Russell D | -- | Lincoln Land Title Inc | |
| Witten Daniel R | -- | Lincoln Evens Land Title Com | |
| Petterson Gary E | -- | None Available |
Source: Public Records
Mortgage History
| Date | Status | Borrower | Loan Amount |
|---|---|---|---|
| Previous Owner | Blythe Russell D | $266,000 | |
| Previous Owner | Witten Daniel R | $220,000 |
Source: Public Records
Tax History Compared to Growth
Tax History
| Year | Tax Paid | Tax Assessment Tax Assessment Total Assessment is a certain percentage of the fair market value that is determined by local assessors to be the total taxable value of land and additions on the property. | Land | Improvement |
|---|---|---|---|---|
| 2025 | $3,220 | $64,300 | $6,650 | $57,650 |
| 2024 | $3,220 | $57,650 | $5,700 | $51,950 |
| 2023 | $3,159 | $57,650 | $5,700 | $51,950 |
| 2022 | $2,844 | $51,660 | $5,700 | $45,960 |
| 2021 | $2,827 | $51,660 | $5,700 | $45,960 |
| 2020 | $2,629 | $47,290 | $5,700 | $41,590 |
| 2019 | $2,620 | $47,290 | $5,700 | $41,590 |
| 2018 | $2,628 | $45,850 | $4,560 | $41,290 |
| 2017 | $2,607 | $43,050 | $4,560 | $38,490 |
| 2016 | $2,475 | $43,050 | $4,560 | $38,490 |
| 2015 | $2,466 | $43,050 | $4,560 | $38,490 |
| 2014 | $2,621 | $45,350 | $3,800 | $41,550 |
Source: Public Records
Map
Nearby Homes
- 710 S Magnolia Ave
- 904 Elizabeth St
- 830 E Rachael Dr
- 838 E Rachael Dr
- 645 S Assisi Way
- 1145 S Henry Ave
- 952 E Valley Trail Dr
- 1252 S Wilder Trail
- 623 S Garden Way
- 970 E Valley Trail Dr
- 892 E Valley Trail Dr
- 1228 E Ritter St
- 1319 E Valley Trail Dr
- 1463 S Barnard Ct
- 1447 S Barnard Way
- 1855 Vicksburg Passage
- 1892 Vicksburg Passage
- 1864 Vicksburg Passage
- 1889 Vicksburg Passage
- 1125 E Ritter St
- 1001 S Shuyler Ln
- 1001 S Shuyler St
- 911 S Shuyler St
- 903 S Shuyler St
- 920 S Shuyler St
- 912 S Shuyler Ln
- 1009 S Shuyler St
- 912 S Shuyler St
- 835 S Shuyler St
- 904 S Shuyler St
- 701 S Magnolia Ave
- 702 S Magnolia Ave
- 836 S Shuyler St
- 829 S Shuyler St
- 828 S Shuyler Ln
- 828 S Shuyler St
- 668 S Magnolia Ave
- 662 S Magnolia Ave
- 852 Elizabeth St
- 844 Elizabeth St