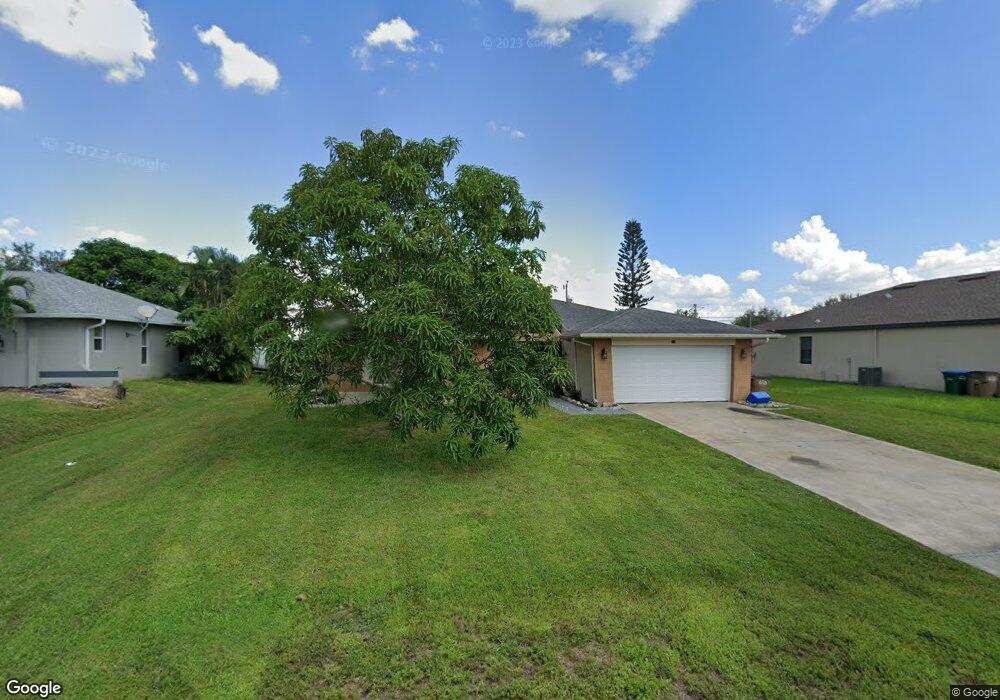
919 SE 5th Place Unit 41 Cape Coral, FL 33990
Hancock NeighborhoodEstimated Value: $252,000 - $273,000
2
Beds
2
Baths
1,288
Sq Ft
$202/Sq Ft
Est. Value
About This Home
This home is located at 919 SE 5th Place Unit 41, Cape Coral, FL 33990 and is currently estimated at $260,571, approximately $202 per square foot. 919 SE 5th Place Unit 41 is a home located in Lee County with nearby schools including Caloosa Elementary School, Hancock Creek Elementary School, and Tropic Isles Elementary School.
Ownership History
Date
Name
Owned For
Owner Type
Purchase Details
Closed on
Feb 8, 2017
Sold by
Lglesias Victor
Bought by
Davis Maryse
Current Estimated Value
Purchase Details
Closed on
May 24, 2006
Sold by
Iglesias Victor Vitelio and Iglesias Margie
Bought by
Iglesias Victor Vitelio and Iglesias Margie
Home Financials for this Owner
Home Financials are based on the most recent Mortgage that was taken out on this home.
Original Mortgage
$116,000
Interest Rate
6.54%
Mortgage Type
New Conventional
Purchase Details
Closed on
Mar 15, 2002
Sold by
Pollard Frances W
Bought by
Iglesias Victor Vitelio
Home Financials for this Owner
Home Financials are based on the most recent Mortgage that was taken out on this home.
Original Mortgage
$89,300
Interest Rate
6.8%
Create a Home Valuation Report for This Property
The Home Valuation Report is an in-depth analysis detailing your home's value as well as a comparison with similar homes in the area
Home Values in the Area
Average Home Value in this Area
Purchase History
| Date | Buyer | Sale Price | Title Company |
|---|---|---|---|
| Davis Maryse | $100,000 | Sandbar Title Llc | |
| Iglesias Victor Vitelio | -- | K E L Title Ins Agency Inc | |
| Iglesias Victor Vitelio | $94,000 | -- |
Source: Public Records
Mortgage History
| Date | Status | Borrower | Loan Amount |
|---|---|---|---|
| Previous Owner | Iglesias Victor Vitelio | $116,000 | |
| Previous Owner | Iglesias Victor Vitelio | $89,300 |
Source: Public Records
Tax History Compared to Growth
Tax History
| Year | Tax Paid | Tax Assessment Tax Assessment Total Assessment is a certain percentage of the fair market value that is determined by local assessors to be the total taxable value of land and additions on the property. | Land | Improvement |
|---|---|---|---|---|
| 2025 | $4,746 | $196,367 | -- | -- |
| 2024 | $4,746 | $178,515 | -- | -- |
| 2023 | $4,501 | $162,286 | $0 | $0 |
| 2022 | $4,097 | $147,533 | $0 | $0 |
| 2021 | $3,839 | $134,130 | $24,000 | $110,130 |
| 2020 | $3,461 | $121,928 | $24,000 | $97,928 |
| 2019 | $3,407 | $120,314 | $24,000 | $96,314 |
| 2018 | $3,323 | $113,866 | $24,000 | $89,866 |
| 2017 | $1,715 | $55,677 | $0 | $0 |
| 2016 | $1,729 | $95,895 | $16,000 | $79,895 |
| 2015 | $1,706 | $82,994 | $15,000 | $67,994 |
| 2014 | $1,742 | $76,701 | $12,032 | $64,669 |
| 2013 | -- | $66,397 | $4,800 | $61,597 |
Source: Public Records
Map
Nearby Homes
- 903 SE 5th Place
- 906 SE 6th Ct
- 817 SE 5th Place
- 822 SE 6th Ct
- 507 SE 8th Terrace
- 904 SE 4th Place
- 541 SE 8th Terrace
- 1009 SE 5th Ave
- 606 SE 8th Terrace Unit 37
- 705 SE 9th Terrace
- 715 SE 9th Terrace
- 704 SE 8th St
- 401 SE 10th Ln
- 505 SE 7th St
- 617 SE 7th St
- 501 SE 7th St
- 712 SE 8th St Unit A
- 1111 SE 5th Ave
- 824 SE 3rd Place
- 711 SE 8th St
- 919 SE 5th Place
- 915 SE 5th Place
- 923 SE 5th Place
- 924 SE 5th Ct
- 911 SE 5th Place
- 927 SE 5th Place
- 914 SE 5th Ct
- 920 SE 5th Place
- 916 SE 5th Place
- 928 SE 5th Ct Unit 24
- 924 SE 5th Place
- 924 SE 5th Place
- 912 SE 5th Place Unit 20
- 907 SE 5th Place
- 931 SE 5th Place
- 932 SE 5th Ct
- 908 SE 5th Place Unit 24
- 919 SE 5th Ct
- 923 SE 5th Ct Unit 43
- 923 SE 5th Ct