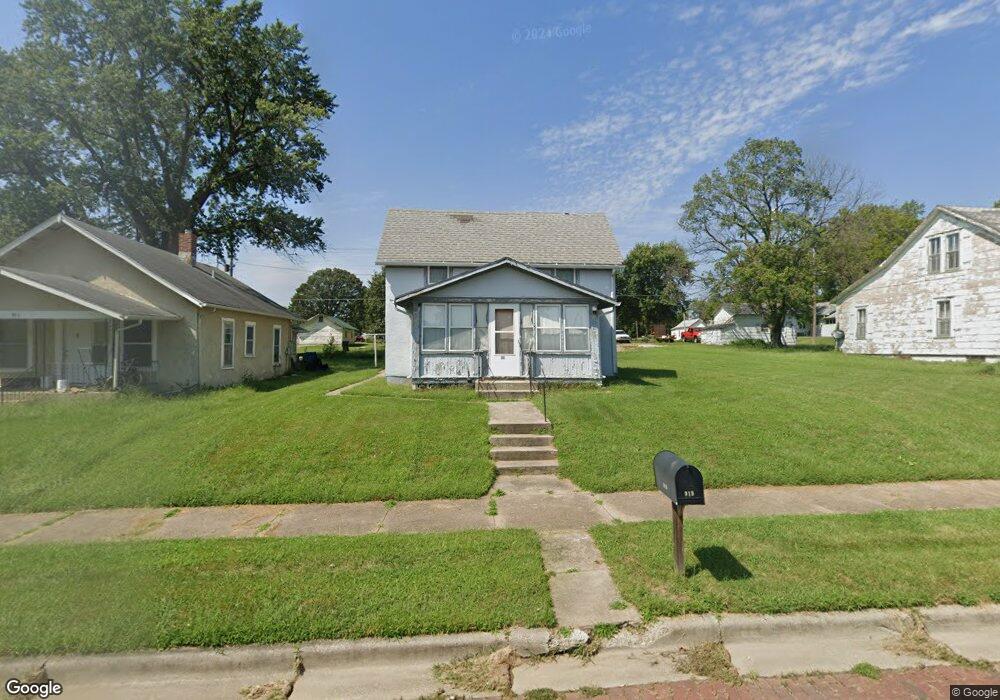
919 Stone St Falls City, NE 68355
Estimated Value: $54,000 - $100,000
3
Beds
1
Bath
1,162
Sq Ft
$62/Sq Ft
Est. Value
About This Home
This home is located at 919 Stone St, Falls City, NE 68355 and is currently estimated at $72,186, approximately $62 per square foot. 919 Stone St is a home located in Richardson County with nearby schools including Falls City North Elementary School, Falls City South Elementary School, and Falls City Middle School.
Ownership History
Date
Name
Owned For
Owner Type
Purchase Details
Closed on
Jan 23, 2007
Sold by
Campbell Leon C and Campbell Sally J
Bought by
Koelzer Polly A
Current Estimated Value
Purchase Details
Closed on
Jan 27, 2006
Sold by
Tackett Richard and Tackett Mary H
Bought by
Campbell Leon C and Campbell Sally J
Purchase Details
Closed on
Nov 12, 2003
Sold by
Midfirst Bank
Bought by
Tackett Richard and Tackett Mary H
Purchase Details
Closed on
May 8, 2003
Sold by
Lambrecht Thad
Bought by
Midfirst Bank
Create a Home Valuation Report for This Property
The Home Valuation Report is an in-depth analysis detailing your home's value as well as a comparison with similar homes in the area
Home Values in the Area
Average Home Value in this Area
Purchase History
| Date | Buyer | Sale Price | Title Company |
|---|---|---|---|
| Koelzer Polly A | -- | -- | |
| Koelzer Polly A | $35,000 | -- | |
| Campbell Leon C | $11,000 | -- | |
| Tackett Richard | $7,500 | -- | |
| Midfirst Bank | $15,300 | -- |
Source: Public Records
Tax History Compared to Growth
Tax History
| Year | Tax Paid | Tax Assessment Tax Assessment Total Assessment is a certain percentage of the fair market value that is determined by local assessors to be the total taxable value of land and additions on the property. | Land | Improvement |
|---|---|---|---|---|
| 2025 | $250 | $26,091 | $3,863 | $22,228 |
| 2024 | $250 | $24,833 | $3,863 | $20,970 |
| 2023 | $745 | $45,390 | $3,863 | $41,527 |
| 2022 | $818 | $42,622 | $2,552 | $40,070 |
| 2021 | $727 | $38,823 | $2,552 | $36,271 |
| 2020 | $703 | $37,096 | $2,552 | $34,544 |
| 2019 | $694 | $36,090 | $2,552 | $33,538 |
| 2018 | $682 | $35,113 | $2,552 | $32,561 |
| 2017 | $683 | $35,113 | $2,552 | $32,561 |
| 2016 | $662 | $34,165 | $2,552 | $31,613 |
| 2015 | $664 | $34,165 | $2,552 | $31,613 |
| 2014 | $663 | $34,165 | $2,552 | $31,613 |
Source: Public Records
Map
Nearby Homes