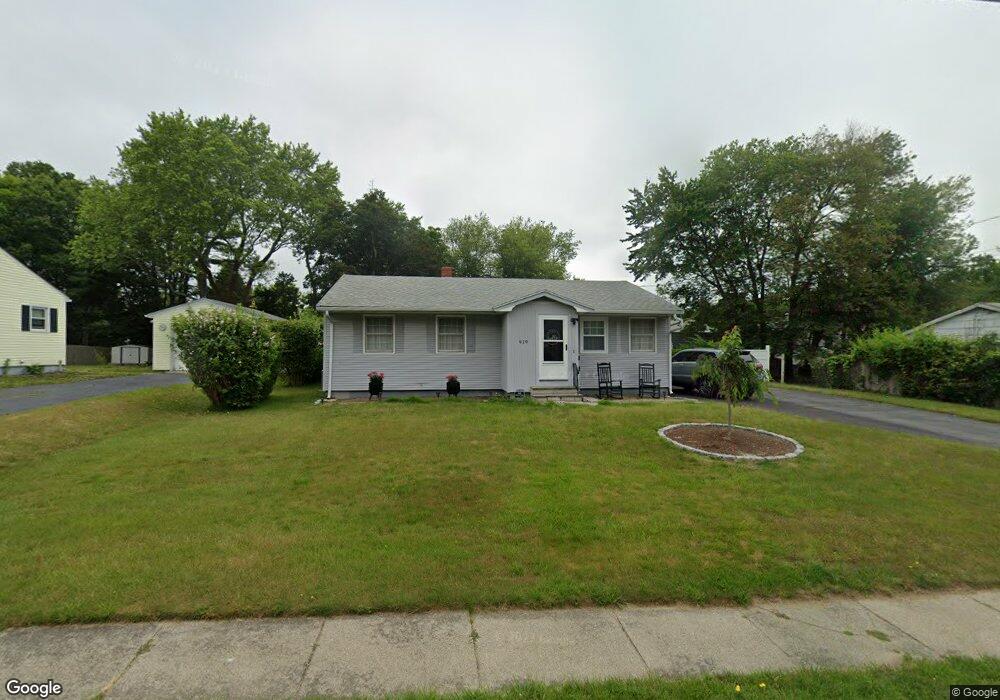
919 Tobey St New Bedford, MA 02745
Estimated Value: $424,000 - $446,000
3
Beds
1
Bath
988
Sq Ft
$444/Sq Ft
Est. Value
About This Home
This home is located at 919 Tobey St, New Bedford, MA 02745 and is currently estimated at $439,005, approximately $444 per square foot. 919 Tobey St is a home located in Bristol County with nearby schools including Casimir Pulaski Elementary School, Normandin Middle School, and New Bedford High School.
Ownership History
Date
Name
Owned For
Owner Type
Purchase Details
Closed on
Oct 29, 2021
Sold by
Camacho Fillipaa and Dias Flipia A
Bought by
Medeiros Kimberly and Medeiros Kenneth
Current Estimated Value
Purchase Details
Closed on
Jul 14, 2015
Sold by
Dias Alfred P and Dias Suzanne M
Bought by
Dias Christopher and Camacho Filipa A
Home Financials for this Owner
Home Financials are based on the most recent Mortgage that was taken out on this home.
Original Mortgage
$155,000
Interest Rate
3.87%
Mortgage Type
New Conventional
Purchase Details
Closed on
May 31, 1990
Sold by
Cote Arthur E
Bought by
Dias Alfred P
Home Financials for this Owner
Home Financials are based on the most recent Mortgage that was taken out on this home.
Original Mortgage
$68,000
Interest Rate
10.25%
Mortgage Type
Purchase Money Mortgage
Create a Home Valuation Report for This Property
The Home Valuation Report is an in-depth analysis detailing your home's value as well as a comparison with similar homes in the area
Home Values in the Area
Average Home Value in this Area
Purchase History
| Date | Buyer | Sale Price | Title Company |
|---|---|---|---|
| Medeiros Kimberly | $347,000 | None Available | |
| Dias Christopher | $200,000 | -- | |
| Dias Christopher | $200,000 | -- | |
| Dias Alfred P | $128,000 | -- |
Source: Public Records
Mortgage History
| Date | Status | Borrower | Loan Amount |
|---|---|---|---|
| Previous Owner | Dias Christopher | $155,000 | |
| Previous Owner | Dias Alfred P | $68,000 |
Source: Public Records
Tax History Compared to Growth
Tax History
| Year | Tax Paid | Tax Assessment Tax Assessment Total Assessment is a certain percentage of the fair market value that is determined by local assessors to be the total taxable value of land and additions on the property. | Land | Improvement |
|---|---|---|---|---|
| 2025 | $4,294 | $379,700 | $163,900 | $215,800 |
| 2024 | $4,264 | $355,300 | $178,200 | $177,100 |
| 2023 | $4,170 | $291,800 | $143,400 | $148,400 |
| 2022 | $3,865 | $248,700 | $133,200 | $115,500 |
| 2021 | $3,810 | $244,400 | $133,200 | $111,200 |
| 2020 | $3,849 | $238,200 | $133,200 | $105,000 |
| 2019 | $3,683 | $223,600 | $128,000 | $95,600 |
| 2018 | $3,487 | $209,700 | $128,000 | $81,700 |
| 2017 | $3,351 | $200,800 | $125,500 | $75,300 |
| 2016 | $3,122 | $189,300 | $122,900 | $66,400 |
| 2015 | $2,872 | $182,600 | $117,800 | $64,800 |
| 2014 | $2,736 | $180,500 | $115,200 | $65,300 |
Source: Public Records
Map
Nearby Homes
- 946 Thorndike St
- 26 Blueberry Dr
- 16 Swallow St
- 2 Woodland Rd
- 4597 Acushnet Ave
- 13 Luscomb Ln
- 34 Poplar Rd
- 1063 Westgate St
- 82 Susan St
- SS Charbonneau Ln
- 210 Heritage Dr
- 145 Heritage Dr
- 34 Wood Duck Rd
- 62 Longview Rd
- 63 County Rd
- 700 Pine Hill Dr
- 1269 Bartlett St
- 67 Morses Ln
- 3289 Acushnet Ave Unit 2
- 1045 Forbes St