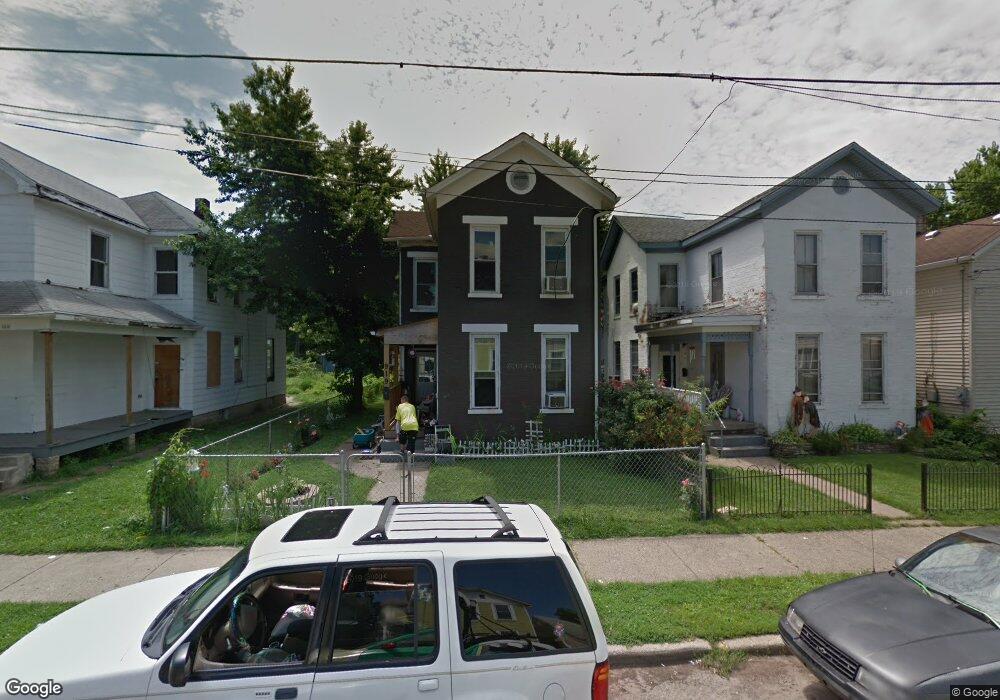
919 Vine St Hamilton, OH 45011
East Hamilton NeighborhoodEstimated Value: $117,386 - $193,000
3
Beds
2
Baths
1,536
Sq Ft
$90/Sq Ft
Est. Value
About This Home
This home is located at 919 Vine St, Hamilton, OH 45011 and is currently estimated at $138,847, approximately $90 per square foot. 919 Vine St is a home located in Butler County with nearby schools including Fairwood Elementary School, Garfield Middle School, and Hamilton Freshman School.
Ownership History
Date
Name
Owned For
Owner Type
Purchase Details
Closed on
May 16, 2022
Sold by
Shannon French
Bought by
Stewart William
Current Estimated Value
Purchase Details
Closed on
Oct 6, 2009
Sold by
Parshall April and Parshall Aprile
Bought by
French Shannon
Purchase Details
Closed on
Jul 2, 2007
Sold by
Hill James and Hill Shay
Bought by
Parshall April
Purchase Details
Closed on
Feb 2, 2006
Sold by
Callahan Annie Sester and Callahan Annie
Bought by
Parshall April and Hill James
Create a Home Valuation Report for This Property
The Home Valuation Report is an in-depth analysis detailing your home's value as well as a comparison with similar homes in the area
Home Values in the Area
Average Home Value in this Area
Purchase History
| Date | Buyer | Sale Price | Title Company |
|---|---|---|---|
| Stewart William | $59,030 | Stitsinger Steven M | |
| French Shannon | $9,000 | Attorney | |
| Parshall April | -- | Attorney | |
| Parshall April | $20,000 | None Available |
Source: Public Records
Tax History
| Year | Tax Paid | Tax Assessment Tax Assessment Total Assessment is a certain percentage of the fair market value that is determined by local assessors to be the total taxable value of land and additions on the property. | Land | Improvement |
|---|---|---|---|---|
| 2025 | $1,260 | $26,560 | $3,330 | $23,230 |
| 2024 | $1,260 | $26,560 | $3,330 | $23,230 |
| 2023 | $1,210 | $26,560 | $3,330 | $23,230 |
| 2022 | $2,106 | $21,430 | $3,330 | $18,100 |
| 2021 | $1,030 | $20,670 | $3,330 | $17,340 |
| 2020 | $1,070 | $20,670 | $3,330 | $17,340 |
| 2019 | $1,242 | $16,960 | $3,360 | $13,600 |
| 2018 | $880 | $16,960 | $3,360 | $13,600 |
| 2017 | $887 | $16,960 | $3,360 | $13,600 |
| 2016 | $920 | $16,830 | $3,360 | $13,470 |
| 2015 | $823 | $16,830 | $3,360 | $13,470 |
| 2014 | $2,579 | $16,830 | $3,360 | $13,470 |
| 2013 | $2,579 | $13,940 | $3,360 | $10,580 |
Source: Public Records
Map
Nearby Homes
Your Personal Tour Guide
Ask me questions while you tour the home.