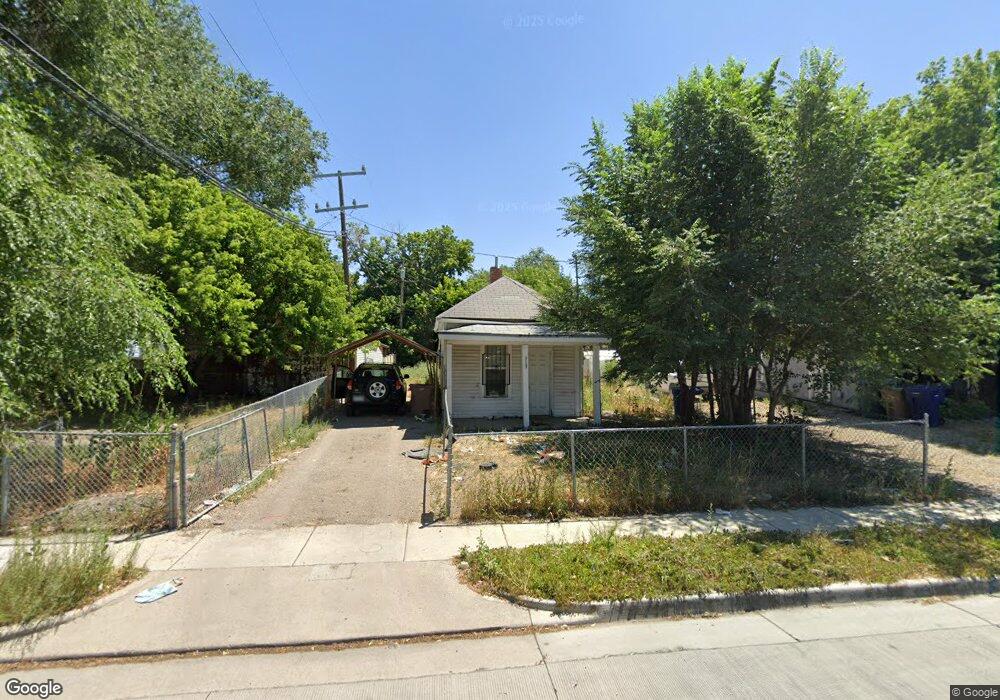
919 W Genesee Ave Salt Lake City, UT 84104
Poplar Grove NeighborhoodEstimated Value: $298,000 - $345,000
1
Bed
1
Bath
610
Sq Ft
$524/Sq Ft
Est. Value
About This Home
This home is located at 919 W Genesee Ave, Salt Lake City, UT 84104 and is currently estimated at $319,926, approximately $524 per square foot. 919 W Genesee Ave is a home located in Salt Lake County with nearby schools including Riley Elementary School, Glendale Middle, and Highland High School.
Ownership History
Date
Name
Owned For
Owner Type
Purchase Details
Closed on
Jan 4, 2022
Sold by
Bak Family Trust
Bought by
Baird Trust
Current Estimated Value
Purchase Details
Closed on
Jan 3, 2022
Sold by
Bak Family Trust
Bought by
Baird Trust
Purchase Details
Closed on
Oct 12, 2011
Sold by
Kalaher Becky A
Bought by
Kalaher Jenaf Becky and B A K Family Trust
Purchase Details
Closed on
Apr 28, 2006
Sold by
Kopps Sharon Ledeen Balliger and Kopps Vernon Chad
Bought by
Kalaher Becky A
Purchase Details
Closed on
Feb 21, 1997
Sold by
Balliger Gary Lee
Bought by
Kopps Sharon Ledeen Balliger and Kopps Vernon Chad
Create a Home Valuation Report for This Property
The Home Valuation Report is an in-depth analysis detailing your home's value as well as a comparison with similar homes in the area
Home Values in the Area
Average Home Value in this Area
Purchase History
| Date | Buyer | Sale Price | Title Company |
|---|---|---|---|
| Baird Trust | -- | Us Title | |
| Baird Trust | -- | Us Title | |
| Kalaher Jenaf Becky | -- | None Available | |
| Kalaher Becky A | -- | First American Title | |
| Kopps Sharon Ledeen Balliger | -- | -- |
Source: Public Records
Tax History Compared to Growth
Tax History
| Year | Tax Paid | Tax Assessment Tax Assessment Total Assessment is a certain percentage of the fair market value that is determined by local assessors to be the total taxable value of land and additions on the property. | Land | Improvement |
|---|---|---|---|---|
| 2025 | $983 | $216,000 | $100,000 | $116,000 |
| 2024 | $983 | $187,600 | $94,700 | $92,900 |
| 2023 | $912 | $167,800 | $91,000 | $76,800 |
| 2022 | $973 | $167,900 | $89,300 | $78,600 |
| 2021 | $839 | $131,000 | $67,600 | $63,400 |
| 2020 | $809 | $120,300 | $60,400 | $59,900 |
| 2019 | $786 | $109,900 | $60,400 | $49,500 |
| 2018 | $369 | $79,700 | $51,800 | $27,900 |
| 2017 | $649 | $82,800 | $51,800 | $31,000 |
| 2016 | $166 | $76,900 | $43,600 | $33,300 |
| 2015 | $197 | $81,300 | $44,200 | $37,100 |
| 2014 | $660 | $75,200 | $42,200 | $33,000 |
Source: Public Records
Map
Nearby Homes