Estimated Value: $100,224 - $186,000
--
Bed
2
Baths
1,106
Sq Ft
$128/Sq Ft
Est. Value
About This Home
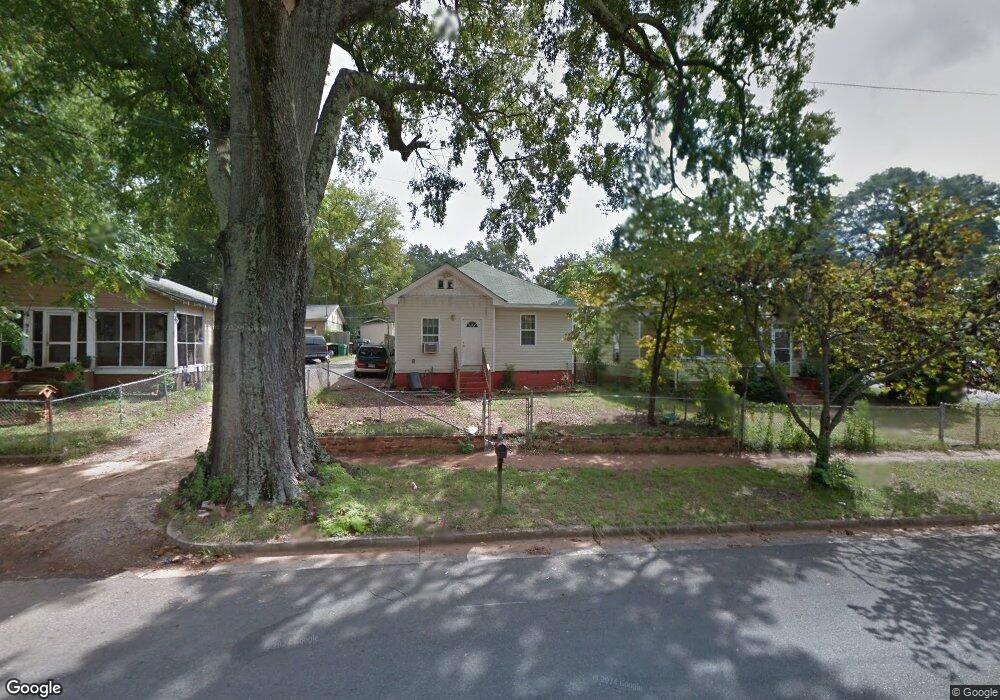
This home is located at 919 Walnut Ave SW, Rome, GA 30161 and is currently estimated at $141,306, approximately $127 per square foot. 919 Walnut Ave SW is a home located in Floyd County with nearby schools including Dan McCarty Middle School, Rome High School, and Darlington School.
Ownership History
Date
Name
Owned For
Owner Type
Purchase Details
Closed on
May 3, 2010
Sold by
Berry Tom
Bought by
Diego Sebastian P
Current Estimated Value
Purchase Details
Closed on
Jan 11, 2008
Bought by
P and R
Purchase Details
Closed on
Jul 30, 2004
Bought by
P and R
Purchase Details
Closed on
Jun 9, 2004
Sold by
Sun Trust Bank Fka Trust Company Bank Of
Bought by
Berry Tom
Purchase Details
Closed on
Sep 2, 2003
Sold by
Dean Evelyn M
Bought by
Sun Trust Bank Fka Trust Company Bank Of
Purchase Details
Closed on
Oct 19, 1995
Bought by
P and R
Purchase Details
Closed on
Mar 10, 1981
Sold by
Barnes James L
Bought by
Barnes Kathleen L
Purchase Details
Closed on
Mar 2, 1971
Sold by
Alred G B
Bought by
Barnes James L
Purchase Details
Closed on
Jan 1, 1901
Bought by
Alred G B
Create a Home Valuation Report for This Property
The Home Valuation Report is an in-depth analysis detailing your home's value as well as a comparison with similar homes in the area
Home Values in the Area
Average Home Value in this Area
Purchase History
| Date | Buyer | Sale Price | Title Company |
|---|---|---|---|
| Diego Sebastian P | -- | -- | |
| P | -- | -- | |
| P | $40,000 | -- | |
| Berry Tom | $21,000 | -- | |
| Sun Trust Bank Fka Trust Company Bank Of | $30,000 | -- | |
| P | -- | -- | |
| P | -- | -- | |
| P | -- | -- | |
| P | -- | -- | |
| P | -- | -- | |
| P | -- | -- | |
| P | -- | -- | |
| Dean Evelyn M | $29,900 | -- | |
| Barnes Kathleen L | -- | -- | |
| Barnes James L | $7,000 | -- | |
| Alred G B | -- | -- |
Source: Public Records
Tax History Compared to Growth
Tax History
| Year | Tax Paid | Tax Assessment Tax Assessment Total Assessment is a certain percentage of the fair market value that is determined by local assessors to be the total taxable value of land and additions on the property. | Land | Improvement |
|---|---|---|---|---|
| 2024 | $1,049 | $27,006 | $4,400 | $22,606 |
| 2023 | $956 | $25,681 | $4,000 | $21,681 |
| 2022 | $774 | $21,219 | $3,200 | $18,019 |
| 2021 | $706 | $19,038 | $3,200 | $15,838 |
| 2020 | $652 | $17,415 | $2,500 | $14,915 |
| 2019 | $612 | $16,530 | $2,500 | $14,030 |
| 2018 | $573 | $15,475 | $2,500 | $12,975 |
| 2017 | $553 | $14,931 | $2,500 | $12,431 |
| 2016 | $542 | $14,602 | $2,480 | $12,122 |
| 2015 | $512 | $14,602 | $2,480 | $12,122 |
| 2014 | $512 | $14,602 | $2,480 | $12,122 |
Source: Public Records
Map
Nearby Homes
- 2 E 10th St SW
- 166 E 11th St SW
- 164 E 11th St SE
- 168 E 11th St SE
- 162 E 11th St SE
- 170 E 11th St SW
- 2 Fair St SW
- 801 Maple Ave SW
- 9 Eastridge Ct SW
- 2 Coral Ave SW
- 702 River Ave SW
- 31 Notasulga Dr SW
- 106 E 14th St SW
- 4 E 15th St SW
- 13 N Blanche Ave SW
- 1502 Spring Creek St SW
- 39 E 16th St SW
- 316 S McLin St SW
- 211 E 11th St SE
- 917 Walnut Ave SW
- 921 Walnut Ave SW
- 915 Walnut Ave SW
- 3 E 10th St SW
- 913 Walnut Ave SW
- 1001 Walnut Ave SW
- 5 E 10th St SW
- 911 Walnut Ave SW
- 1000 Walnut Ave SW
- 4 E 10th St SW
- 914 Walnut Ave SW
- 1003 Walnut Ave SW
- 916 Walnut Ave SW
- 1002 Walnut Ave SW
- 6 E 10th St SW
- 6 E 10th St SW Unit SW
- 909 Walnut Ave SE
- 7 E 10th St SW
- 909 Walnut Ave SW
- 906 Walnut Ave SE