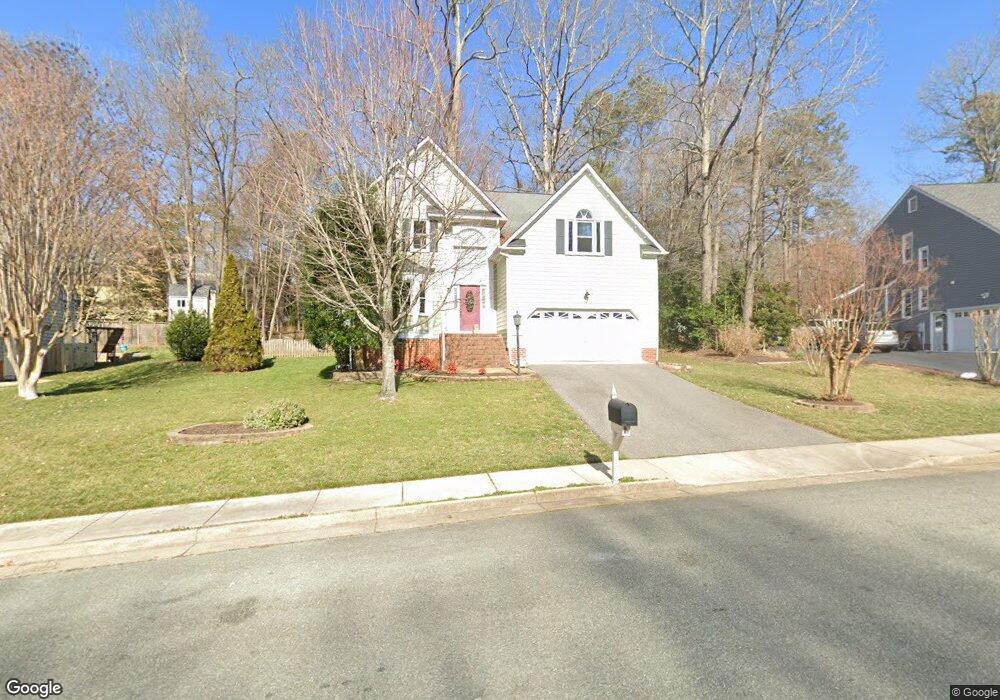
919 Walton Creek Dr Midlothian, VA 23114
Estimated Value: $487,000 - $521,000
4
Beds
3
Baths
2,289
Sq Ft
$219/Sq Ft
Est. Value
About This Home
This home is located at 919 Walton Creek Dr, Midlothian, VA 23114 and is currently estimated at $501,655, approximately $219 per square foot. 919 Walton Creek Dr is a home located in Chesterfield County with nearby schools including Evergreen Elementary, Tomahawk Creek Middle School, and Midlothian High School.
Ownership History
Date
Name
Owned For
Owner Type
Purchase Details
Closed on
Jul 29, 2009
Sold by
Morris William M
Bought by
Troy Terry L
Current Estimated Value
Home Financials for this Owner
Home Financials are based on the most recent Mortgage that was taken out on this home.
Original Mortgage
$276,861
Outstanding Balance
$181,891
Interest Rate
5.36%
Mortgage Type
FHA
Estimated Equity
$319,764
Purchase Details
Closed on
Dec 1, 2006
Sold by
Ange David
Bought by
Morris William
Home Financials for this Owner
Home Financials are based on the most recent Mortgage that was taken out on this home.
Original Mortgage
$231,000
Interest Rate
6.4%
Mortgage Type
New Conventional
Purchase Details
Closed on
Jan 28, 2002
Sold by
Allen David L
Bought by
Ange David K and Ange Debra C
Home Financials for this Owner
Home Financials are based on the most recent Mortgage that was taken out on this home.
Original Mortgage
$180,500
Interest Rate
7.08%
Mortgage Type
New Conventional
Purchase Details
Closed on
May 19, 1997
Sold by
Allen David L
Bought by
Allen David L
Create a Home Valuation Report for This Property
The Home Valuation Report is an in-depth analysis detailing your home's value as well as a comparison with similar homes in the area
Home Values in the Area
Average Home Value in this Area
Purchase History
| Date | Buyer | Sale Price | Title Company |
|---|---|---|---|
| Troy Terry L | $282,000 | -- | |
| Morris William | $300,000 | -- | |
| Ange David K | $190,000 | -- | |
| Allen David L | -- | -- |
Source: Public Records
Mortgage History
| Date | Status | Borrower | Loan Amount |
|---|---|---|---|
| Open | Troy Terry L | $276,861 | |
| Previous Owner | Morris William | $231,000 | |
| Previous Owner | Allen David L | $180,500 |
Source: Public Records
Tax History Compared to Growth
Tax History
| Year | Tax Paid | Tax Assessment Tax Assessment Total Assessment is a certain percentage of the fair market value that is determined by local assessors to be the total taxable value of land and additions on the property. | Land | Improvement |
|---|---|---|---|---|
| 2025 | $4,131 | $461,400 | $83,000 | $378,400 |
| 2024 | $4,131 | $415,500 | $78,000 | $337,500 |
| 2023 | $3,546 | $389,700 | $76,000 | $313,700 |
| 2022 | $3,262 | $354,600 | $74,000 | $280,600 |
| 2021 | $2,965 | $305,200 | $72,000 | $233,200 |
| 2020 | $2,899 | $305,200 | $72,000 | $233,200 |
| 2019 | $2,858 | $300,800 | $72,000 | $228,800 |
| 2018 | $2,803 | $295,000 | $68,000 | $227,000 |
| 2017 | $2,578 | $268,500 | $68,000 | $200,500 |
| 2016 | $2,558 | $266,500 | $66,000 | $200,500 |
| 2015 | $2,604 | $268,600 | $66,000 | $202,600 |
| 2014 | $2,532 | $261,100 | $64,000 | $197,100 |
Source: Public Records
Map
Nearby Homes
- 1301 Wesanne Ln
- 1001 Worsham Green Terrace
- 1400 Cedar Crossing Trail
- 12831 Ashtree Rd
- 419 Walton Park Rd
- 1406 Walton Bluff Terrace
- 914 Spirea Rd
- 12918 Ashtree Rd
- 11506 Glenmont Rd
- 12909 Edgetree Terrace
- 11630 Smoketree Dr
- 13300 Railey Hill Dr
- 11520 Old Carrollton Ct
- 12601 Cottage Mill Rd
- 11761 Edenberry Dr
- 11970 Lucks Ln
- 11603 Durrington Dr
- 11960 Lucks Ln
- 11950 Lucks Ln
- 1618 Darrell Terrace
- 917 Walton Creek Dr
- 921 Walton Creek Dr
- 12723 Walton Ridge Ln
- 12711 Walton Ridge Ln
- 12708 Clearwater Dr
- 918 Walton Creek Dr
- 915 Walton Creek Dr
- 920 Walton Creek Dr
- 12706 Clearwater Dr
- 916 Walton Creek Dr
- 12729 Walton Ridge Ln
- 12705 Walton Ridge Ln
- 913 Walton Creek Dr
- 1000 Walton Creek Dr
- 914 Walton Creek Dr
- 12704 Clearwater Dr
- 12731 Walton Ridge Ln
- 12709 Clearwater Dr
- 12701 Walton Ridge Ln
- 1100 Johanna Bay Dr