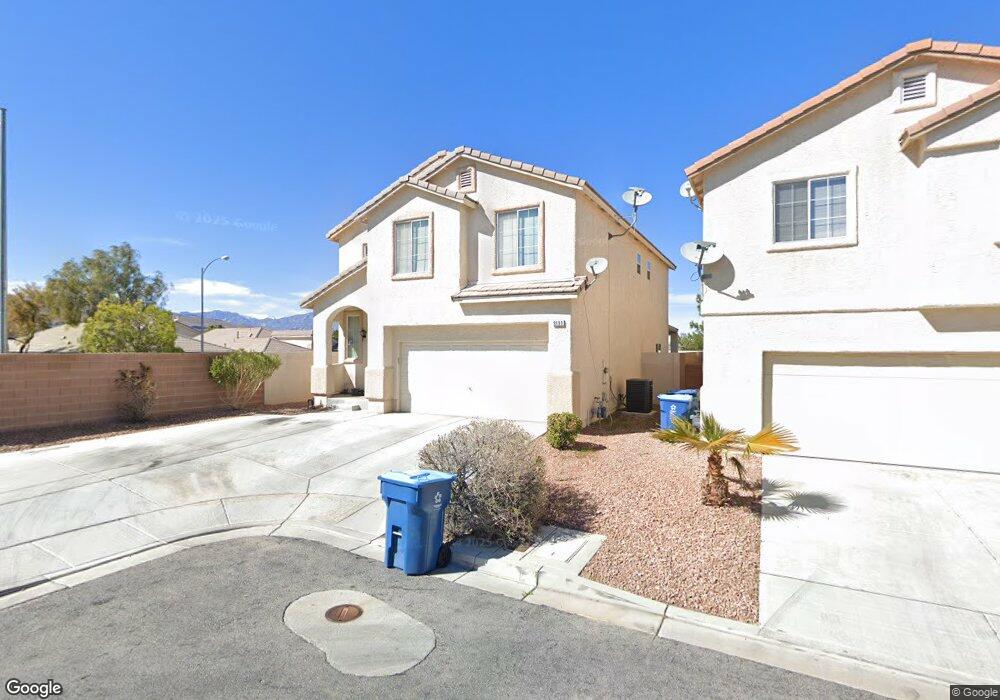
9190 Autumn Mist Ct Las Vegas, NV 89148
Estimated Value: $480,676 - $510,000
3
Beds
3
Baths
2,065
Sq Ft
$239/Sq Ft
Est. Value
About This Home
This home is located at 9190 Autumn Mist Ct, Las Vegas, NV 89148 and is currently estimated at $493,169, approximately $238 per square foot. 9190 Autumn Mist Ct is a home located in Clark County with nearby schools including Wayne N. Tanaka Elementary School, Wilbur & Theresa Faiss Middle School, and Sierra Vista High School.
Ownership History
Date
Name
Owned For
Owner Type
Purchase Details
Closed on
Mar 17, 2013
Sold by
Chao Roger Tu and Chi Kai Li
Bought by
Chao Roger Tu and Chi Kai Li
Current Estimated Value
Purchase Details
Closed on
Nov 8, 2012
Sold by
Rueda Fernando J and Rueda Elvia A
Bought by
Chao Roger Tu and Chi Kai Li
Purchase Details
Closed on
Sep 24, 2007
Sold by
Rueda Fernando and Rueda Elvia
Bought by
Rueda Fernando J and Rueda Elvia A
Purchase Details
Closed on
Aug 19, 2003
Sold by
Oquendo Llc
Bought by
Rueda Fernando and Rueda Elvia
Home Financials for this Owner
Home Financials are based on the most recent Mortgage that was taken out on this home.
Original Mortgage
$176,700
Interest Rate
5.6%
Mortgage Type
Unknown
Create a Home Valuation Report for This Property
The Home Valuation Report is an in-depth analysis detailing your home's value as well as a comparison with similar homes in the area
Home Values in the Area
Average Home Value in this Area
Purchase History
| Date | Buyer | Sale Price | Title Company |
|---|---|---|---|
| Chao Roger Tu | -- | None Available | |
| Chao Roger Tu | $142,400 | Nevada Title Las Vegas | |
| Rueda Fernando J | -- | None Available | |
| Rueda Fernando | $186,040 | United Title Of Nevada |
Source: Public Records
Mortgage History
| Date | Status | Borrower | Loan Amount |
|---|---|---|---|
| Previous Owner | Rueda Fernando | $176,700 |
Source: Public Records
Tax History Compared to Growth
Tax History
| Year | Tax Paid | Tax Assessment Tax Assessment Total Assessment is a certain percentage of the fair market value that is determined by local assessors to be the total taxable value of land and additions on the property. | Land | Improvement |
|---|---|---|---|---|
| 2025 | $2,471 | $115,492 | $38,500 | $76,992 |
| 2024 | $2,288 | $115,492 | $38,500 | $76,992 |
| 2023 | $2,288 | $105,925 | $33,250 | $72,675 |
| 2022 | $2,119 | $94,309 | $28,000 | $66,309 |
| 2021 | $1,962 | $87,547 | $24,500 | $63,047 |
| 2020 | $1,819 | $87,714 | $25,200 | $62,514 |
| 2019 | $1,705 | $80,670 | $19,250 | $61,420 |
| 2018 | $1,627 | $76,894 | $18,200 | $58,694 |
| 2017 | $2,224 | $75,832 | $16,450 | $59,382 |
| 2016 | $1,524 | $66,899 | $11,900 | $54,999 |
| 2015 | $1,520 | $57,243 | $10,850 | $46,393 |
| 2014 | $1,473 | $48,716 | $7,000 | $41,716 |
Source: Public Records
Map
Nearby Homes
- 9219 Broome Ct
- 9163 Vesey Ave
- 9186 Berstler Ave Unit 1A
- 6788 Rose Mallow St Unit 3
- 6670 Tumoulin St
- 6768 Pastel Camellia St
- 9086 Nostrand Ave
- 6646 Tumoulin St
- 9137 Rivington Ave
- 9125 Rivington Ave
- 9113 Rivington Ave
- 9178 Rivington Ave
- 9190 Rivington Ave
- 9184 Rivington Ave
- Plan 1590 at Upton
- Plan 2124 at Upton
- Plan 2469 Modeled at Upton
- Plan 2069 Modeled at Upton
- Plan 1768 Modeled at Upton
- 9142 Rivington Ave
- 9180 Autumn Mist Ct
- 9170 Autumn Mist Ct Unit 2
- 9170 Autumn Mist Ct
- 9170 Autumn Mist Ct
- 9191 Autumn Mist Ct
- 6717 Quarterhorse Ln
- 9160 Autumn Mist Ct
- 9181 Autumn Mist Ct
- 6699 Ellery St
- 9171 Autumn Mist Ct
- 6729 Quarterhorse Ln
- 9161 Autumn Mist Ct
- 6735 Quarterhorse Ln
- 6695 Ellery St
- 6716 Graceda St
- 9177 Nostrand Ave
- 9182 Regal Morning Ct
- 6691 Ellery St
- 9192 Regal Morning Ct
- 6710 Graceda St