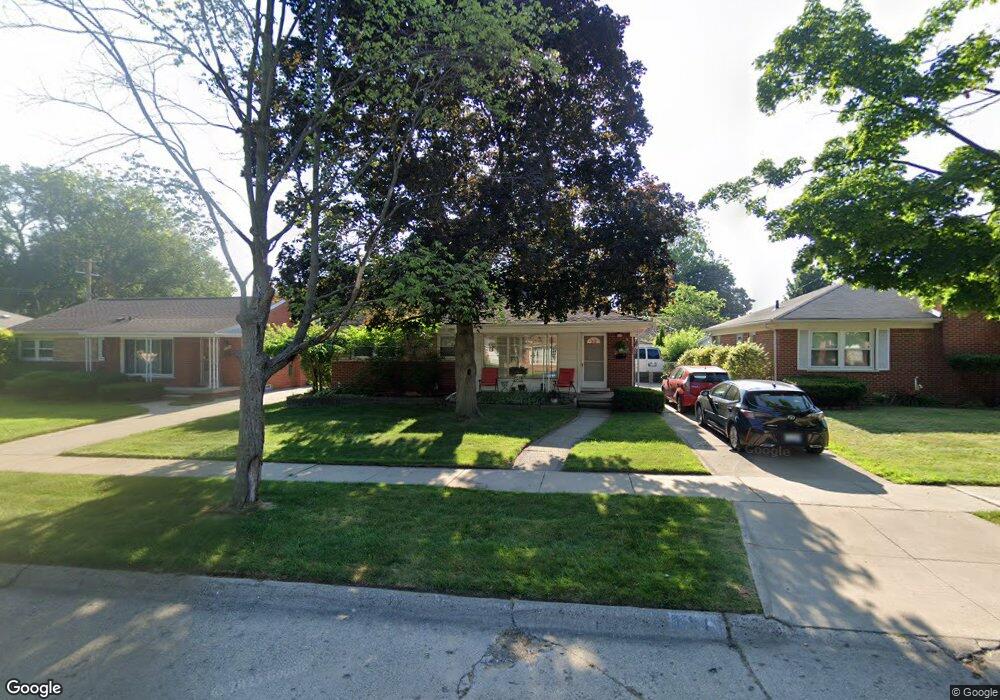
9194 Tecumseh Redford, MI 48239
Estimated Value: $173,631 - $247,000
Studio
2
Baths
1,103
Sq Ft
$197/Sq Ft
Est. Value
About This Home
This home is located at 9194 Tecumseh, Redford, MI 48239 and is currently estimated at $217,658, approximately $197 per square foot. 9194 Tecumseh is a home located in Wayne County with nearby schools including John D. Pierce Middle School, Lee M. Thurston High School, and Westfield Charter Academy.
Ownership History
Date
Name
Owned For
Owner Type
Purchase Details
Closed on
Feb 9, 2022
Sold by
Tylutki William J
Bought by
Tylutki William J and Coultis Pamela Dawn
Current Estimated Value
Purchase Details
Closed on
Feb 1, 2022
Sold by
Tylutki William J
Bought by
Tylutki William J and Coultis Pamela Dawn
Purchase Details
Closed on
Jun 26, 2003
Sold by
Wilinski Larry E
Bought by
Tylutki William J
Purchase Details
Closed on
Aug 6, 2002
Sold by
Travani Mary
Bought by
Wilinski Larry E
Create a Home Valuation Report for This Property
The Home Valuation Report is an in-depth analysis detailing your home's value as well as a comparison with similar homes in the area
Home Values in the Area
Average Home Value in this Area
Purchase History
| Date | Buyer | Sale Price | Title Company |
|---|---|---|---|
| Tylutki William J | -- | None Listed On Document | |
| Tylutki William J | -- | None Listed On Document | |
| Tylutki William J | $161,900 | Lawyers Title Insurance Co | |
| Wilinski Larry E | -- | -- |
Source: Public Records
Tax History
| Year | Tax Paid | Tax Assessment Tax Assessment Total Assessment is a certain percentage of the fair market value that is determined by local assessors to be the total taxable value of land and additions on the property. | Land | Improvement |
|---|---|---|---|---|
| 2025 | $861 | $98,800 | $0 | $0 |
| 2024 | $838 | $92,600 | $0 | $0 |
| 2023 | $803 | $81,500 | $0 | $0 |
| 2022 | $2,343 | $72,800 | $0 | $0 |
| 2021 | $2,277 | $69,200 | $0 | $0 |
| 2020 | $2,246 | $62,200 | $0 | $0 |
| 2019 | $2,197 | $54,600 | $0 | $0 |
| 2018 | $723 | $46,000 | $0 | $0 |
| 2017 | $2,500 | $43,500 | $0 | $0 |
| 2016 | $1,948 | $39,100 | $0 | $0 |
| 2015 | $3,035 | $34,900 | $0 | $0 |
| 2013 | $2,940 | $30,000 | $0 | $0 |
| 2012 | $1,817 | $32,600 | $7,700 | $24,900 |
Source: Public Records
Map
Nearby Homes
- 9010 Leverne
- 9101 Sioux
- 26740 Joy Rd Unit 8
- 26760 Joy Rd Unit E8
- 26710 Joy Rd Unit A
- 26710 Joy Rd Unit A, 10
- 9624 Nathaline
- 8915 Sioux
- 26790 Joy Rd Unit 7
- 9130 Kinloch
- 9540 Mercedes
- 27007 Joy Rd
- 26030 W Chicago
- 9619 Mercedes
- 9983 Hemingway
- 11385 Leverne
- 26923 Constance St
- 11417 Leverne
- 25968 Keith St
- 9114 Cardwell St
Your Personal Tour Guide
Ask me questions while you tour the home.