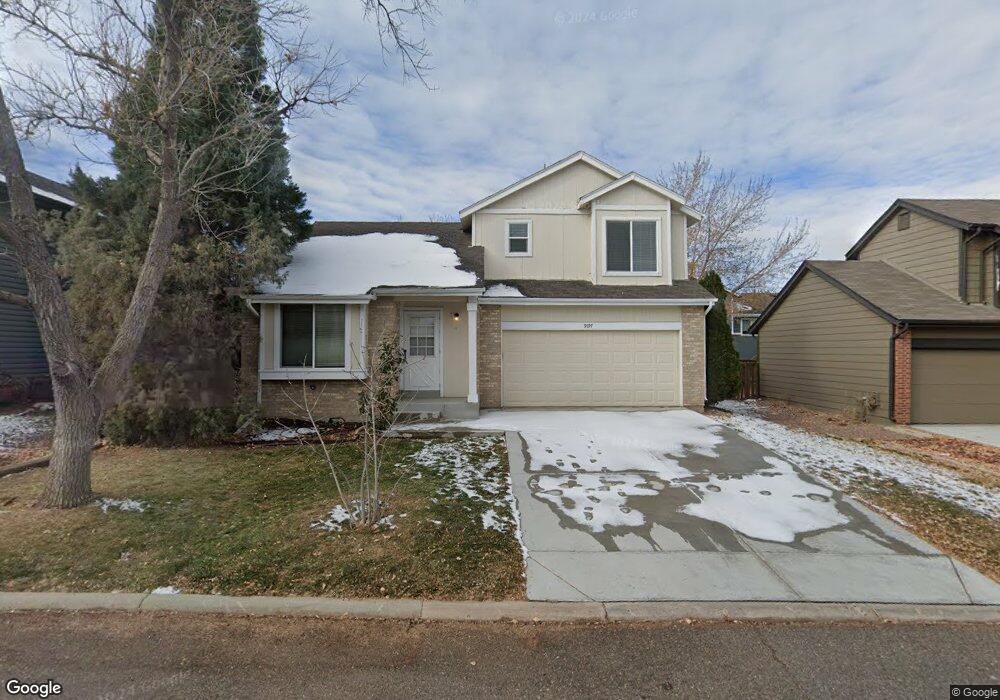
9197 Butterwood Ct Highlands Ranch, CO 80126
Northridge NeighborhoodEstimated Value: $497,000 - $527,000
3
Beds
3
Baths
1,137
Sq Ft
$448/Sq Ft
Est. Value
About This Home
This home is located at 9197 Butterwood Ct, Highlands Ranch, CO 80126 and is currently estimated at $509,767, approximately $448 per square foot. 9197 Butterwood Ct is a home located in Douglas County with nearby schools including Northridge Elementary School, Mountain Ridge Middle School, and Mountain Vista High School.
Ownership History
Date
Name
Owned For
Owner Type
Purchase Details
Closed on
Sep 11, 2017
Sold by
Knapp Susan Lynn
Bought by
Knapp David M
Current Estimated Value
Purchase Details
Closed on
Aug 30, 2017
Sold by
S D Knapp Investors Llc
Bought by
Knapp Susan Lynn and Knapp David M
Purchase Details
Closed on
Apr 6, 2000
Sold by
Knapp David M and Knapp Susan L
Bought by
S & D Knapp Investors Llc
Purchase Details
Closed on
May 23, 1995
Sold by
Quam Mark S and Quam Jill
Bought by
Knapp David M and Knapp Susan L
Purchase Details
Closed on
Sep 30, 1992
Sold by
Jones Michael A and Jones Rebecca A
Bought by
Quam Mark S and Quam Jill
Purchase Details
Closed on
Mar 21, 1991
Sold by
Tocci Frank J and Tocci Charlotte
Bought by
Jones Michael A and Jones Rebecca A
Purchase Details
Closed on
Apr 25, 1984
Sold by
Mission Viejo Co
Bought by
Tocci Frank J and Tocci Charlotte
Create a Home Valuation Report for This Property
The Home Valuation Report is an in-depth analysis detailing your home's value as well as a comparison with similar homes in the area
Home Values in the Area
Average Home Value in this Area
Purchase History
| Date | Buyer | Sale Price | Title Company |
|---|---|---|---|
| Knapp David M | $150,000 | None Available | |
| Knapp Susan Lynn | -- | None Available | |
| Knapp Susan Lynn | -- | None Available | |
| S & D Knapp Investors Llc | -- | -- | |
| Knapp David M | $112,000 | Land Title | |
| Quam Mark S | $93,500 | -- | |
| Jones Michael A | $87,600 | -- | |
| Tocci Frank J | $86,400 | -- |
Source: Public Records
Tax History Compared to Growth
Tax History
| Year | Tax Paid | Tax Assessment Tax Assessment Total Assessment is a certain percentage of the fair market value that is determined by local assessors to be the total taxable value of land and additions on the property. | Land | Improvement |
|---|---|---|---|---|
| 2024 | $2,958 | $35,070 | $8,200 | $26,870 |
| 2023 | $2,953 | $35,070 | $8,200 | $26,870 |
| 2022 | $2,209 | $24,180 | $5,690 | $18,490 |
| 2021 | $2,299 | $24,180 | $5,690 | $18,490 |
| 2020 | $2,124 | $22,900 | $5,350 | $17,550 |
| 2019 | $2,132 | $22,900 | $5,350 | $17,550 |
| 2018 | $1,797 | $19,010 | $4,760 | $14,250 |
| 2017 | $1,636 | $19,010 | $4,760 | $14,250 |
| 2016 | $1,491 | $17,000 | $3,690 | $13,310 |
| 2015 | $1,523 | $17,000 | $3,690 | $13,310 |
| 2014 | $1,363 | $14,050 | $3,500 | $10,550 |
Source: Public Records
Map
Nearby Homes
- 9191 Hickory Cir
- 715 Myrtlewood Ct
- 772 Ivywood Ct
- 1146 Cherry Blossom Ct
- 9171 Stargrass Cir
- 818 Summer Dr Unit 7D
- 745 Stowe St
- 274 Saddlewood Cir
- 283 Saddlewood Cir
- 9050 Hunters Creek St
- 1495 Goldsmith Dr
- 1554 Sunset Ridge Rd
- 154 Blue Spruce Ct
- 714 Old Stone Dr
- 145 Blue Spruce Ct
- 507 Fox Hunt Cir
- 8822 Eagles Nest Ln
- 8975 S Coyote St
- 1707 Sunset Ridge Rd
- 3 Burgundy Ct
- 9187 Butterwood Ct
- 9207 Butterwood Ct
- 9184 Hickory Cir
- 9198 Butterwood Ct
- 9198 S Butterwood Ct
- 9221 Butterwood Ct
- 9208 Butterwood Ct
- 9188 Butterwood Ct
- 9218 Butterwood Ct
- 9227 Butterwood Ct
- 9227 S Butterwood Ct
- 755 Ridgeglen Way
- 775 Ridgeglen Way
- 9228 Butterwood Ct
- 735 Ridgeglen Way
- 795 Ridgeglen Way
- 9212 Hickory Cir
- 715 Ridgeglen Way
- 944 Lily Ct
- 974 Lily Ct