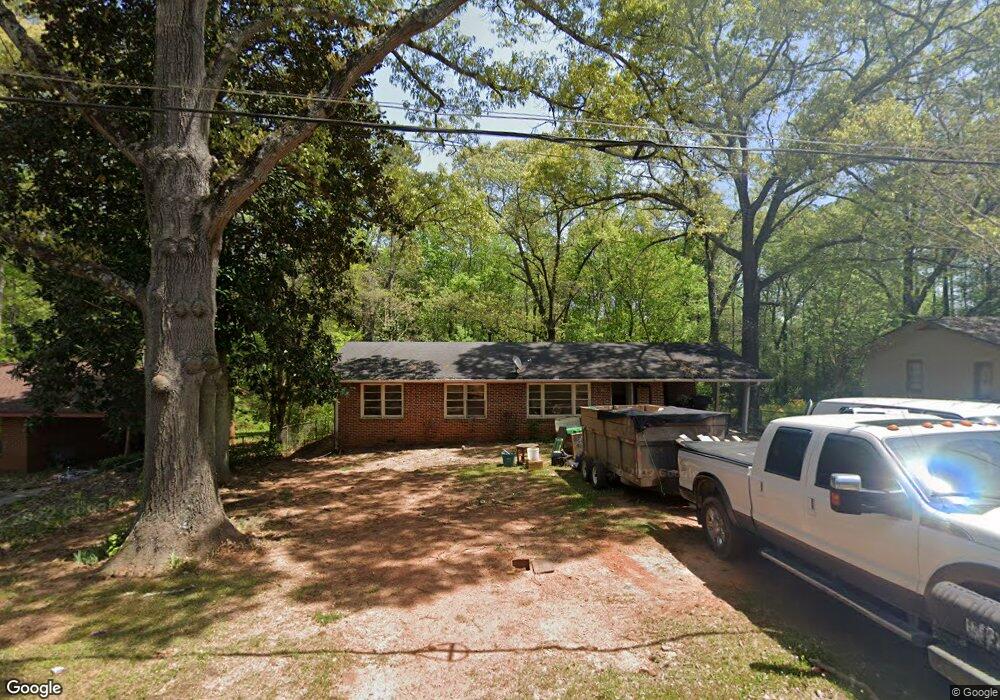
9199 Blackwell St SW Covington, GA 30014
Estimated Value: $159,000 - $182,000
3
Beds
1
Bath
1,100
Sq Ft
$156/Sq Ft
Est. Value
About This Home
This home is located at 9199 Blackwell St SW, Covington, GA 30014 and is currently estimated at $171,972, approximately $156 per square foot. 9199 Blackwell St SW is a home located in Newton County with nearby schools including Middle Ridge Elementary School, Clements Middle School, and Newton High School.
Ownership History
Date
Name
Owned For
Owner Type
Purchase Details
Closed on
Feb 19, 2021
Sold by
All Star Properties And Investments Llc
Bought by
Rs Rental I Llc
Current Estimated Value
Purchase Details
Closed on
May 14, 2010
Sold by
Federal Natl Mtg Assn Fnma
Bought by
Simmons Larry
Purchase Details
Closed on
Feb 2, 2010
Sold by
Wells Fargo Bk Na
Bought by
Federal Natl Mtg Assn Fnma
Purchase Details
Closed on
Aug 24, 2001
Sold by
Lynx Investments
Bought by
Green Kevin E
Home Financials for this Owner
Home Financials are based on the most recent Mortgage that was taken out on this home.
Original Mortgage
$71,100
Interest Rate
7.18%
Mortgage Type
New Conventional
Purchase Details
Closed on
May 15, 2001
Sold by
Terrell John W
Bought by
Lynx Invests Inc
Home Financials for this Owner
Home Financials are based on the most recent Mortgage that was taken out on this home.
Original Mortgage
$66,000
Interest Rate
6.98%
Mortgage Type
New Conventional
Purchase Details
Closed on
Jun 28, 1996
Sold by
Mitchell Danny C
Bought by
Terrell John W Vernice T
Create a Home Valuation Report for This Property
The Home Valuation Report is an in-depth analysis detailing your home's value as well as a comparison with similar homes in the area
Home Values in the Area
Average Home Value in this Area
Purchase History
| Date | Buyer | Sale Price | Title Company |
|---|---|---|---|
| Rs Rental I Llc | $1,035,000 | -- | |
| Simmons Larry | -- | -- | |
| Federal Natl Mtg Assn Fnma | -- | -- | |
| Wells Fargo Bk Na | $53,374 | -- | |
| Green Kevin E | $71,000 | -- | |
| Lynx Invests Inc | $64,000 | -- | |
| Terrell John W Vernice T | $55,500 | -- |
Source: Public Records
Mortgage History
| Date | Status | Borrower | Loan Amount |
|---|---|---|---|
| Previous Owner | Green Kevin E | $71,100 | |
| Previous Owner | Lynx Invests Inc | $66,000 | |
| Closed | Terrell John W Vernice T | $0 |
Source: Public Records
Tax History Compared to Growth
Tax History
| Year | Tax Paid | Tax Assessment Tax Assessment Total Assessment is a certain percentage of the fair market value that is determined by local assessors to be the total taxable value of land and additions on the property. | Land | Improvement |
|---|---|---|---|---|
| 2025 | $1,213 | $40,760 | $8,000 | $32,760 |
| 2024 | $1,141 | $37,800 | $8,000 | $29,800 |
| 2023 | $1,010 | $31,080 | $5,000 | $26,080 |
| 2022 | $734 | $22,600 | $5,000 | $17,600 |
| 2021 | $838 | $23,080 | $5,000 | $18,080 |
| 2020 | $723 | $18,120 | $5,000 | $13,120 |
| 2019 | $738 | $18,160 | $5,000 | $13,160 |
| 2018 | $361 | $17,560 | $5,000 | $12,560 |
| 2017 | $467 | $11,360 | $2,000 | $9,360 |
| 2016 | $475 | $11,560 | $2,800 | $8,760 |
| 2015 | $581 | $14,120 | $2,000 | $12,120 |
| 2014 | $581 | $14,120 | $0 | $0 |
Source: Public Records
Map
Nearby Homes
- 9107 Morris Dr SW
- 0 Morris Dr SW Unit 10609869
- 10133 Morris Dr SW
- 9102 Morris Dr SW
- 9126 Griffin Ln SW
- 10214 Allen Dr SW
- 10178 Allen Dr SW
- 9184 Thrash St SW
- 10182 Blackwell St
- 9142 Ford St SW
- 9200 Jefferson Ave SW
- 8330 N Sterling Lakes Dr
- 9186 Puckett St SW
- 0.35 ACRES Kirk St SW
- 00 Kirk St SW
- 45 Wyndmont Way
- 9160 Puckett St SW
- LOT 105 Puckett St SW
- 80 Taunton Rd
- 130 Taunton Rd
- 9205 Blackwell St SW
- 9191 Blackwell St SW
- 0 Blackwell St SW Unit 10218661
- 0 Blackwell St SW Unit 7294918
- 9183 Blackwell St SW
- 10101 Blackwell St SW
- 9200 Blackwell St SW
- 9190 Blackwell St SW
- 9206 Blackwell St SW
- 9173 Blackwell St SW
- 9184 Blackwell St SW
- 9212 Blackwell St SW
- 10107 Blackwell St SW
- 9178 Blackwell St SW
- 9163 Blackwell St SW
- 9141 Morris Dr SW
- 10113 Blackwell St SW
- 9121 Morris Dr SW
- 10108 Blackwell St SW
- 10105 Morris Dr SW