92-1240 Palahia St Unit U203 Kapolei, HI 96707
Estimated Value: $523,000 - $533,000
2
Beds
2
Baths
807
Sq Ft
$654/Sq Ft
Est. Value
About This Home
This home is located at 92-1240 Palahia St Unit U203, Kapolei, HI 96707 and is currently estimated at $527,987, approximately $654 per square foot. 92-1240 Palahia St Unit U203 is a home located in Honolulu County with nearby schools including Barbers Point Elementary School, Kapolei Middle School, and Honouliuli Middle School.
Ownership History
Date
Name
Owned For
Owner Type
Purchase Details
Closed on
Dec 22, 2009
Sold by
Dalton Michael John and Warwick Linda Susan
Bought by
Villanueva Mark Natividad
Current Estimated Value
Home Financials for this Owner
Home Financials are based on the most recent Mortgage that was taken out on this home.
Original Mortgage
$174,700
Outstanding Balance
$113,187
Interest Rate
4.77%
Mortgage Type
New Conventional
Estimated Equity
$414,800
Purchase Details
Closed on
Dec 16, 2004
Sold by
Dixon Chong Mo Han
Bought by
Dalton Michael John and Warwick Linda Susan
Home Financials for this Owner
Home Financials are based on the most recent Mortgage that was taken out on this home.
Original Mortgage
$220,500
Interest Rate
5.87%
Mortgage Type
Unknown
Create a Home Valuation Report for This Property
The Home Valuation Report is an in-depth analysis detailing your home's value as well as a comparison with similar homes in the area
Home Values in the Area
Average Home Value in this Area
Purchase History
| Date | Buyer | Sale Price | Title Company |
|---|---|---|---|
| Villanueva Mark Natividad | $233,000 | Fam | |
| Dalton Michael John | $245,000 | -- |
Source: Public Records
Mortgage History
| Date | Status | Borrower | Loan Amount |
|---|---|---|---|
| Open | Villanueva Mark Natividad | $174,700 | |
| Previous Owner | Dalton Michael John | $220,500 |
Source: Public Records
Tax History Compared to Growth
Tax History
| Year | Tax Paid | Tax Assessment Tax Assessment Total Assessment is a certain percentage of the fair market value that is determined by local assessors to be the total taxable value of land and additions on the property. | Land | Improvement |
|---|---|---|---|---|
| 2025 | $1,443 | $538,900 | $277,100 | $261,800 |
| 2024 | $1,443 | $532,200 | $266,500 | $265,700 |
| 2023 | $1,195 | $541,500 | $266,500 | $275,000 |
| 2022 | $1,274 | $464,100 | $255,800 | $208,300 |
| 2021 | $1,010 | $388,600 | $255,800 | $132,800 |
| 2020 | $1,001 | $385,900 | $255,800 | $130,100 |
| 2019 | $1,122 | $400,700 | $234,500 | $166,200 |
| 2018 | $973 | $358,000 | $191,900 | $166,100 |
| 2017 | $866 | $327,500 | $144,900 | $182,600 |
| 2016 | $762 | $297,800 | $136,400 | $161,400 |
| 2015 | $671 | $271,700 | $132,100 | $139,600 |
| 2014 | $581 | $258,700 | $169,400 | $89,300 |
Source: Public Records
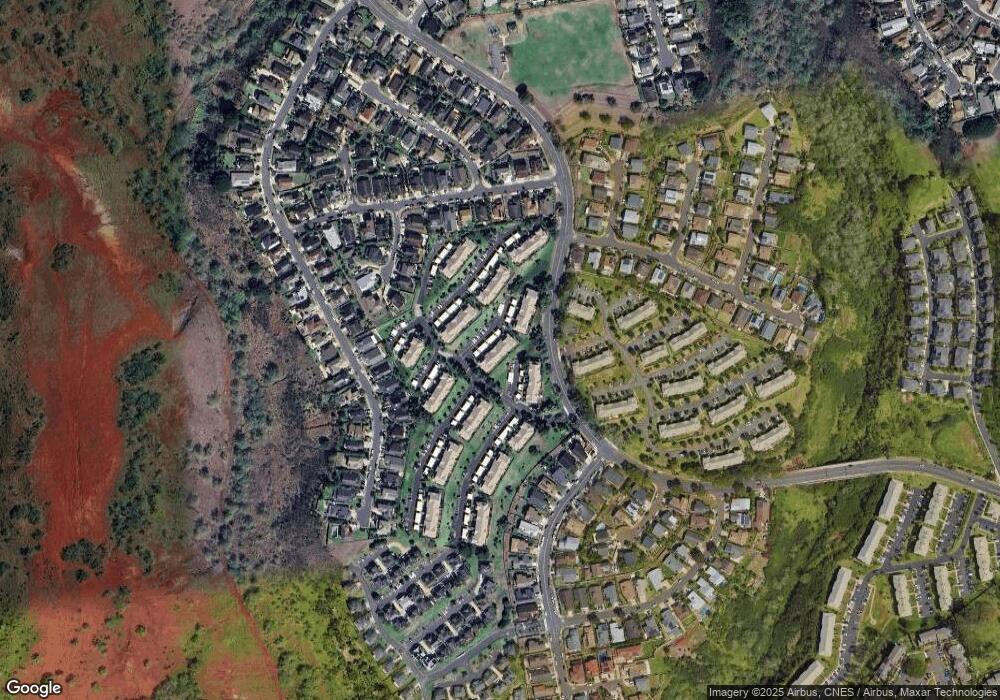
Map
Nearby Homes
- 92-1242 Palahia St Unit T205
- 92-1232 Palahia St Unit AA102
- 92-1232 Palahia St Unit AA101
- 92-1191 Palahia St Unit N203
- 92-1183 Palahia St Unit K203
- 92-1274 Palahia St
- 92-1202 Palahia St Unit Q101
- 92-1212 Palahia St Unit W106
- 92-1179 Palahia St Unit J202
- 92-1163 Palahia St Unit E102
- 92-1155 Palahia St Unit A201
- 92-5005 Limukele St
- 92-7023 Kahea St
- 92-6018 Kalemakapii St
- 92-1087 Palahia St Unit L
- 92-1087 Palahia St Unit B
- 92-1089 Palahia St Unit J
- 92-7049 Elele St Unit 102
- 92-7049 Elele St Unit 86
- 92-7049 Elele St Unit 22
- 92-1240 Palahia St Unit U101
- 92-1240 Palahia St Unit U205
- 92-1240 Palahia St Unit U105
- 92-1240 Palahia St Unit U103
- 92-1240 Palahia St Unit U104
- 92-1240 Palahia St Unit U106
- 92-1240 Palahia St Unit U102
- 92-1240 Palahia St Unit U201
- 92-1240 Palahia St Unit U202
- 92-1240 Palahia St Unit U206
- 92-1240 Palahia St Unit U204
- 92-1200 Palahia St Unit R204
- 92-1200 Palahia St Unit R202
- 92-1200 Palahia St Unit S102
- 92-1200 Palahia St Unit R101
- 92-1200 Palahia St Unit R201
- 92-1200 Palahia St Unit R203
- 92-1200 Palahia St Unit R102
- 92-1200 Palahia St Unit R104
- 92-1200 Palahia St Unit R103