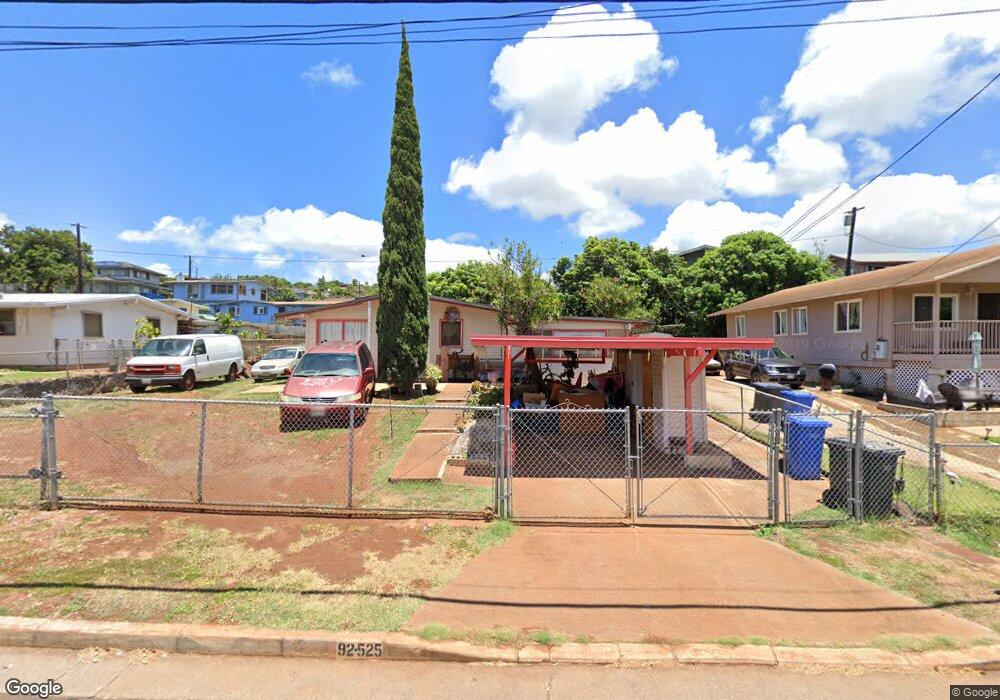
92-525 Palailai St Kapolei, HI 96707
Estimated Value: $649,000 - $793,679
3
Beds
1
Bath
1,020
Sq Ft
$723/Sq Ft
Est. Value
About This Home
This home is located at 92-525 Palailai St, Kapolei, HI 96707 and is currently estimated at $737,170, approximately $722 per square foot. 92-525 Palailai St is a home located in Honolulu County with nearby schools including Makakilo Elementary School, Kapolei Middle School, and Honouliuli Middle School.
Ownership History
Date
Name
Owned For
Owner Type
Purchase Details
Closed on
Mar 18, 2008
Sold by
Torres Renato Singh
Bought by
Torres Renato Singh and Torres Marecil Melejor
Current Estimated Value
Purchase Details
Closed on
Jul 16, 2001
Sold by
Lehman Capital
Bought by
Torres Renato Singh
Home Financials for this Owner
Home Financials are based on the most recent Mortgage that was taken out on this home.
Original Mortgage
$128,000
Outstanding Balance
$49,579
Interest Rate
7.21%
Estimated Equity
$687,591
Purchase Details
Closed on
Jun 6, 2000
Sold by
Kimura Harlan Y
Bought by
Lehman Capital
Purchase Details
Closed on
Feb 10, 1998
Sold by
Rodriguez Norberto Tabalno and Rodriguez Tomasa Solven
Bought by
Rimarim Belly Jose Tuquib and Girard Judaline Sanaga
Home Financials for this Owner
Home Financials are based on the most recent Mortgage that was taken out on this home.
Original Mortgage
$138,750
Interest Rate
10%
Mortgage Type
FHA
Purchase Details
Closed on
Sep 14, 1995
Sold by
Rodriguez Norberto Tabalno and Rodriguez Tomasa Soliven
Bought by
Rodriguez Norberto Tabalno and Rodriguez Tomasa Soliven
Create a Home Valuation Report for This Property
The Home Valuation Report is an in-depth analysis detailing your home's value as well as a comparison with similar homes in the area
Home Values in the Area
Average Home Value in this Area
Purchase History
| Date | Buyer | Sale Price | Title Company |
|---|---|---|---|
| Torres Renato Singh | -- | Accommodation | |
| Torres Renato Singh | $160,000 | -- | |
| Lehman Capital | $52,480 | Title Guaranty | |
| Rimarim Belly Jose Tuquib | $185,000 | -- | |
| Rodriguez Norberto Tabalno | -- | -- |
Source: Public Records
Mortgage History
| Date | Status | Borrower | Loan Amount |
|---|---|---|---|
| Open | Torres Renato Singh | $128,000 | |
| Previous Owner | Rimarim Belly Jose Tuquib | $138,750 | |
| Closed | Torres Renato Singh | $24,000 |
Source: Public Records
Tax History Compared to Growth
Tax History
| Year | Tax Paid | Tax Assessment Tax Assessment Total Assessment is a certain percentage of the fair market value that is determined by local assessors to be the total taxable value of land and additions on the property. | Land | Improvement |
|---|---|---|---|---|
| 2025 | $2,677 | $744,500 | $714,300 | $30,200 |
| 2024 | $2,677 | $764,900 | $714,300 | $50,600 |
| 2023 | $2,681 | $765,900 | $741,800 | $24,100 |
| 2022 | $2,610 | $745,800 | $692,300 | $53,500 |
| 2021 | $2,204 | $629,800 | $582,400 | $47,400 |
| 2020 | $2,150 | $614,200 | $537,500 | $76,700 |
| 2019 | $2,185 | $624,200 | $537,500 | $86,700 |
| 2018 | $2,060 | $588,600 | $485,800 | $102,800 |
| 2017 | $1,796 | $513,100 | $413,400 | $99,700 |
| 2016 | $1,590 | $454,200 | $361,800 | $92,400 |
| 2015 | $1,575 | $450,000 | $335,900 | $114,100 |
| 2014 | -- | $409,800 | $320,400 | $89,400 |
Source: Public Records
Map
Nearby Homes
- 92-551 Ualehei St
- 92-543 Kokole Place
- 92-622 Akaula St
- 92-527 Uhiuala St
- 92-546 Akaawa St
- 92-719 Kuhoho Place
- 92-807 Kuhoho St
- 92-338 Akaula St
- 92-782 Kuhoho St
- 91-1413 Halahua St
- 92-735 Welo St
- 92-735 Makakilo Dr Unit 12
- 92-2006 Kulihi St
- 92-612 Nohona St Unit 1
- 92-787 Makakilo Dr Unit D29
- 92-743 Nohopaa St
- 91-1067 Akolo St
- 91-1059 Akolo St
- 92-831 Makakilo Dr Unit 4
- 92-840 Wainohia St
- 92-521 Palailai St
- 92-529 Palailai St
- 92-509 Akaula St
- 92-533 Palailai St
- 92-515 Palailai St
- 92-526 Pilipono St
- 92-528 Pilipono St
- 92-508 Awawa St
- 92-526 Palailai St
- 92-530 Palailai St
- 92-522 Palailai St
- 92-534 Palailai St
- 92-510 Awawa St
- 92-496 Awawa St
- 92-530 Pilipono St
- 92-519 Akaula St
- 92-514 Awawa St
- 92-492 Awawa St
- 92-485 Akaula St
- 92-532 Pilipono St