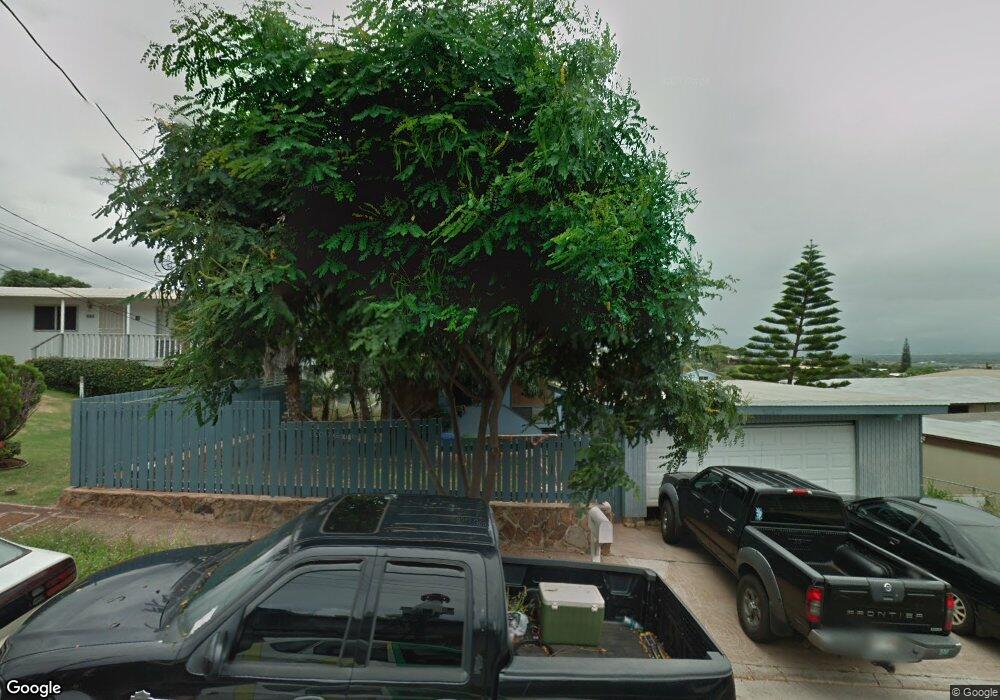
92-639 Aahualii St Kapolei, HI 96707
Estimated Value: $824,000 - $894,000
3
Beds
2
Baths
1,188
Sq Ft
$718/Sq Ft
Est. Value
About This Home
This home is located at 92-639 Aahualii St, Kapolei, HI 96707 and is currently estimated at $853,331, approximately $718 per square foot. 92-639 Aahualii St is a home located in Honolulu County with nearby schools including Makakilo Elementary School, Kapolei Middle School, and Honouliuli Middle School.
Ownership History
Date
Name
Owned For
Owner Type
Purchase Details
Closed on
Dec 11, 2006
Sold by
Mulder Frederic P
Bought by
Madix Michael Moriarty and Madix Kimberly Ann
Current Estimated Value
Home Financials for this Owner
Home Financials are based on the most recent Mortgage that was taken out on this home.
Original Mortgage
$420,187
Outstanding Balance
$251,360
Interest Rate
6.32%
Mortgage Type
VA
Estimated Equity
$601,971
Purchase Details
Closed on
Feb 21, 2004
Sold by
Mulder Frederic Peter
Bought by
Mulder Frederic P and Frederic P Mulder Revocable Trust
Purchase Details
Closed on
Feb 14, 2003
Sold by
Brown Byron Evert and Brown Yon
Bought by
Mulder Frederic Peter
Home Financials for this Owner
Home Financials are based on the most recent Mortgage that was taken out on this home.
Original Mortgage
$200,000
Interest Rate
5.89%
Create a Home Valuation Report for This Property
The Home Valuation Report is an in-depth analysis detailing your home's value as well as a comparison with similar homes in the area
Home Values in the Area
Average Home Value in this Area
Purchase History
| Date | Buyer | Sale Price | Title Company |
|---|---|---|---|
| Madix Michael Moriarty | $480,000 | None Available | |
| Mulder Frederic P | -- | -- | |
| Mulder Frederic Peter | $268,000 | -- |
Source: Public Records
Mortgage History
| Date | Status | Borrower | Loan Amount |
|---|---|---|---|
| Open | Madix Michael Moriarty | $420,187 | |
| Previous Owner | Mulder Frederic Peter | $200,000 |
Source: Public Records
Tax History Compared to Growth
Tax History
| Year | Tax Paid | Tax Assessment Tax Assessment Total Assessment is a certain percentage of the fair market value that is determined by local assessors to be the total taxable value of land and additions on the property. | Land | Improvement |
|---|---|---|---|---|
| 2025 | $2,702 | $772,600 | $682,600 | $90,000 |
| 2024 | $2,702 | $772,100 | $682,600 | $89,500 |
| 2023 | $2,739 | $782,600 | $708,800 | $73,800 |
| 2022 | $2,591 | $740,300 | $661,600 | $78,700 |
| 2021 | $2,268 | $648,100 | $556,600 | $91,500 |
| 2020 | $2,254 | $644,100 | $530,400 | $113,700 |
| 2019 | $2,239 | $639,600 | $530,400 | $109,200 |
| 2018 | $2,161 | $617,500 | $479,400 | $138,100 |
| 2017 | $1,937 | $553,400 | $408,000 | $145,400 |
| 2016 | $1,787 | $510,500 | $357,000 | $153,500 |
| 2015 | $1,674 | $478,400 | $331,500 | $146,900 |
| 2014 | -- | $441,400 | $316,200 | $125,200 |
Source: Public Records
Map
Nearby Homes
- 92-527 Uhiuala St
- 92-338 Akaula St
- 92-611 Newa St
- 92-543 Kokole Place
- 92-612 Nohona St Unit 1
- 92-622 Akaula St
- 92-551 Ualehei St
- 92-546 Akaawa St
- 92-840 Wainohia St
- 92-743 Nohopaa St
- 92-787 Makakilo Dr Unit D29
- 92-831 Makakilo Dr Unit 4
- 92-719 Kuhoho Place
- 92-782 Kuhoho St
- 92-807 Kuhoho St
- 92-111 Oloa Place
- 92-735 Welo St
- 92-902 Panana St
- 92-1117 Panana St Unit 405
- 92-1117 Panana St Unit 404
- 92-643 Aahualii St
- 92-635 Aahualii St
- 92-371 Akaula St
- 92-373 Akaula St
- 92-369 Akaula St
- 92-647 Aahualii St
- 92-631 Aahualii St
- 92-375 Akaula St
- 92-640 Aahualii St
- 92-636 Aahualii St
- 92-367 Akaula St
- 92-644 Aahualii St
- 92-629 Aahualii St
- 92-651 Aahualii St
- 92-648 Aahualii St
- 92-379 Akaula St
- 92-632 Aahualii St
- 92-365 Akaula St
- 92-365 Akaula St Unit Studio
- 92-652 Aahualii St