92-743 Makakilo Dr Unit 26 Kapolei, HI 96707
Estimated Value: $509,000 - $551,000
3
Beds
2
Baths
1,125
Sq Ft
$475/Sq Ft
Est. Value
About This Home
This home is located at 92-743 Makakilo Dr Unit 26, Kapolei, HI 96707 and is currently estimated at $534,221, approximately $474 per square foot. 92-743 Makakilo Dr Unit 26 is a home located in Honolulu County with nearby schools including Makakilo Elementary School, Kapolei Middle School, and Honouliuli Middle School.
Ownership History
Date
Name
Owned For
Owner Type
Purchase Details
Closed on
Mar 13, 2018
Sold by
Fisher Michael Joseph and Fisher Moriko Shiroma
Bought by
Fisher Michael Joseph and Fisher Moriko Shiroma
Current Estimated Value
Purchase Details
Closed on
Nov 20, 2017
Sold by
Fisher Michael Joseph
Bought by
Fisher Michael Joseph and Fisher Moriko Shiroma
Home Financials for this Owner
Home Financials are based on the most recent Mortgage that was taken out on this home.
Original Mortgage
$337,000
Interest Rate
3.88%
Purchase Details
Closed on
Nov 10, 2006
Sold by
Griffin James Joseph and Griffin Rowena
Bought by
Fisher Michael Joseph
Home Financials for this Owner
Home Financials are based on the most recent Mortgage that was taken out on this home.
Original Mortgage
$231,200
Interest Rate
6.28%
Mortgage Type
Unknown
Create a Home Valuation Report for This Property
The Home Valuation Report is an in-depth analysis detailing your home's value as well as a comparison with similar homes in the area
Home Values in the Area
Average Home Value in this Area
Purchase History
| Date | Buyer | Sale Price | Title Company |
|---|---|---|---|
| Fisher Michael Joseph | -- | Accommodation | |
| Fisher Michael Joseph | -- | Accommodation | |
| Fisher Michael Joseph | -- | Fam | |
| Fisher Michael Joseph | -- | Fam | |
| Fisher Michael Joseph | $289,000 | Itc |
Source: Public Records
Mortgage History
| Date | Status | Borrower | Loan Amount |
|---|---|---|---|
| Previous Owner | Fisher Michael Joseph | $337,000 | |
| Previous Owner | Fisher Michael Joseph | $231,200 |
Source: Public Records
Tax History Compared to Growth
Tax History
| Year | Tax Paid | Tax Assessment Tax Assessment Total Assessment is a certain percentage of the fair market value that is determined by local assessors to be the total taxable value of land and additions on the property. | Land | Improvement |
|---|---|---|---|---|
| 2025 | $1,787 | $504,800 | $368,000 | $136,800 |
| 2024 | $1,787 | $510,600 | $353,900 | $156,700 |
| 2023 | $1,757 | $519,900 | $353,900 | $166,000 |
| 2022 | $1,757 | $502,100 | $339,700 | $162,400 |
| 2021 | $1,398 | $399,300 | $339,700 | $59,600 |
| 2020 | $1,376 | $393,200 | $339,700 | $53,500 |
| 2019 | $1,522 | $434,800 | $311,400 | $123,400 |
| 2018 | $1,321 | $377,400 | $254,800 | $122,600 |
| 2017 | $1,209 | $345,300 | $192,500 | $152,800 |
| 2016 | $1,185 | $338,600 | $181,200 | $157,400 |
| 2015 | $1,040 | $297,000 | $175,500 | $121,500 |
| 2014 | $870 | $275,600 | $224,000 | $51,600 |
Source: Public Records
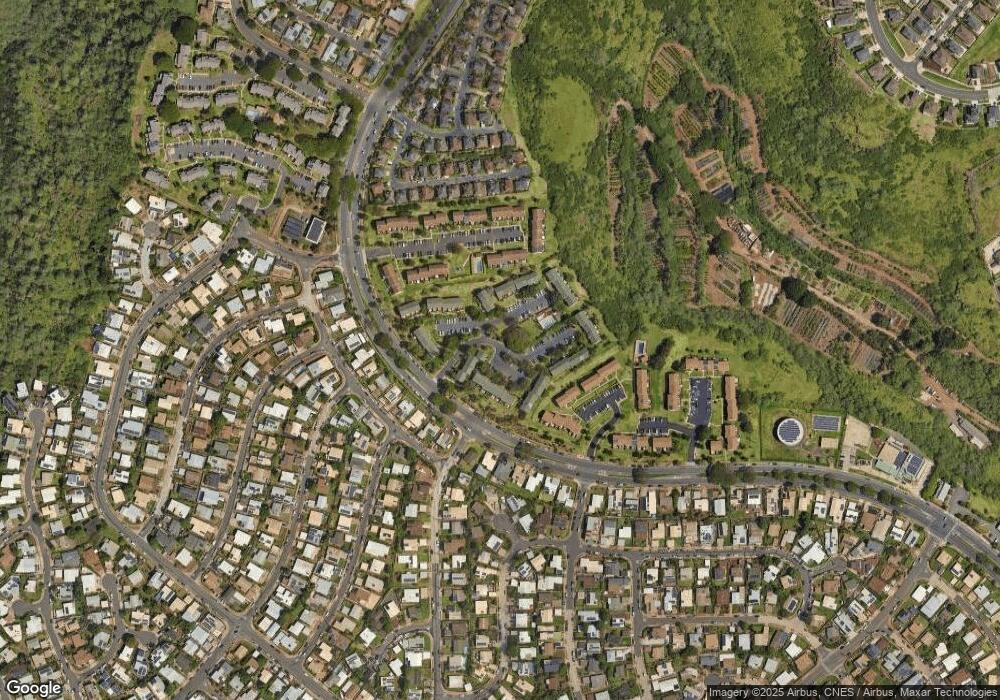
Map
Nearby Homes
- 92-755 Makakilo Dr Unit 52
- 92-755 Makakilo Dr Unit 51
- 92-771 Makakilo Dr Unit 72
- 92-739 Makakilo Dr Unit 21
- 92-787 Makakilo Dr Unit D29
- 92-831 Makakilo Dr Unit 38
- 92-831 Makakilo Dr Unit 4
- 92-831 Makakilo Dr Unit 43
- 92-861 Palailai St
- 92-717 Nohopono St
- 92-627 Auwaea St
- 92-612 Nohona St Unit 1
- 92-691 Wainohia Way
- 92-902 Panana St
- 92-338 Akaula St
- 92-1117 Panana St Unit 404
- 92-706 Palailai St
- 92-1124 Panana St Unit 319
- 92-840 Wainohia St
- 92-988 Panana St Unit 1
- 92-763 Makakilo Dr Unit 65
- 92-759 Makakilo Dr Unit 57
- 92-735 Makakilo Dr Unit 14
- 92-747 Makakilo Dr Unit 37
- 92-739 Makakilo Dr Unit 17
- 92-735 Makakilo Dr Unit 11
- 92-751 Makakilo Dr Unit 39
- 92-739 Makakilo Dr Unit 20
- 92-735 Makakilo Dr Unit 16
- 92-767 Makakilo Dr Unit 68
- 92-747 Makakilo Dr Unit 35
- 92-759 Makakilo Dr Unit 56
- 92-751 Makakilo Dr Unit 46
- 92-747 Makakilo Dr Unit 36
- 92-735 Makakilo Dr Unit 9
- 92-759 Makakilo Dr Unit 55
- 92-763 Makakilo Dr Unit 60
- 92-767 Makakilo Dr Unit 69
- 92-739 Makakilo Dr Unit 23
- 92-751 Makakilo Dr Unit 40