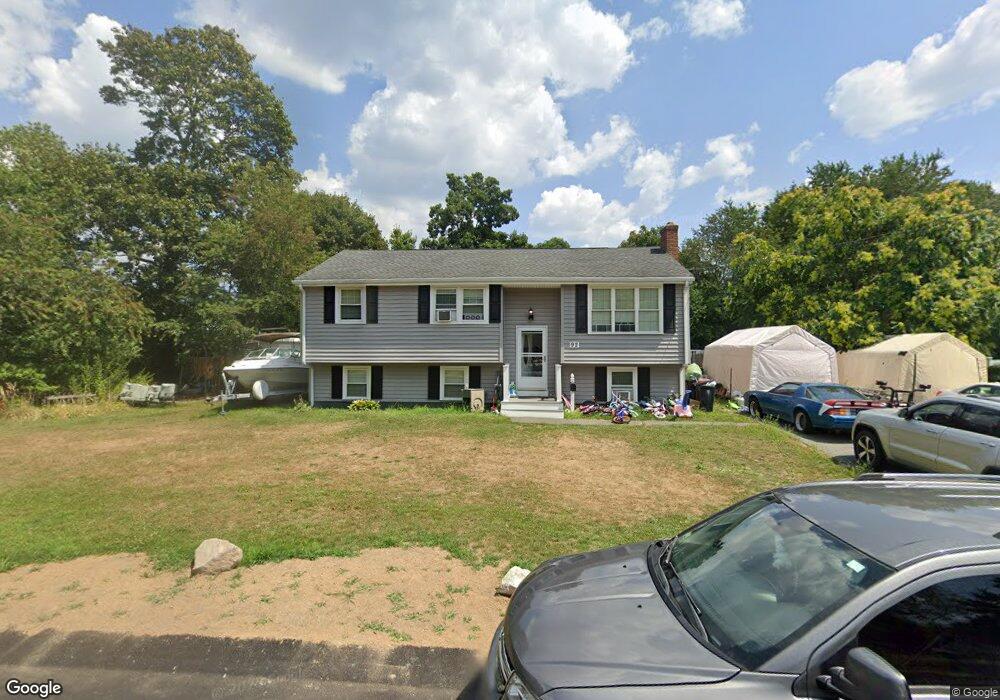
92 Amark Rd Brockton, MA 02302
Montello NeighborhoodEstimated Value: $503,842 - $592,000
3
Beds
1
Bath
1,528
Sq Ft
$346/Sq Ft
Est. Value
About This Home
This home is located at 92 Amark Rd, Brockton, MA 02302 and is currently estimated at $529,211, approximately $346 per square foot. 92 Amark Rd is a home located in Plymouth County with nearby schools including Brookfield Elementary School, Mary E. Baker Elementary School, and Downey Elementary School.
Ownership History
Date
Name
Owned For
Owner Type
Purchase Details
Closed on
Feb 14, 2019
Sold by
Amark Road Rt
Bought by
Mcquiggan Tina and Mcquiggan Stacie L
Current Estimated Value
Purchase Details
Closed on
Oct 9, 2008
Sold by
Mcquiggan Tina M and Gionfriddo Anthony J
Bought by
Mcquiggan Tr Tina M and Gionfriddo Anthony
Purchase Details
Closed on
Apr 1, 2004
Sold by
Gionfriddo Mildred
Bought by
Gionfriddo Anthony
Create a Home Valuation Report for This Property
The Home Valuation Report is an in-depth analysis detailing your home's value as well as a comparison with similar homes in the area
Home Values in the Area
Average Home Value in this Area
Purchase History
| Date | Buyer | Sale Price | Title Company |
|---|---|---|---|
| Mcquiggan Tina | -- | -- | |
| Mcquiggan Tr Tina M | -- | -- | |
| Gionfriddo Anthony | -- | -- |
Source: Public Records
Mortgage History
| Date | Status | Borrower | Loan Amount |
|---|---|---|---|
| Previous Owner | Gionfriddo Anthony | $90,000 | |
| Previous Owner | Gionfriddo Anthony | $20,000 |
Source: Public Records
Tax History
| Year | Tax Paid | Tax Assessment Tax Assessment Total Assessment is a certain percentage of the fair market value that is determined by local assessors to be the total taxable value of land and additions on the property. | Land | Improvement |
|---|---|---|---|---|
| 2025 | $5,878 | $485,400 | $148,600 | $336,800 |
| 2024 | $5,767 | $479,800 | $148,600 | $331,200 |
| 2023 | $5,256 | $404,900 | $113,900 | $291,000 |
| 2022 | $4,778 | $342,000 | $103,600 | $238,400 |
| 2021 | $4,898 | $337,800 | $97,300 | $240,500 |
| 2020 | $4,154 | $274,200 | $93,200 | $181,000 |
| 2019 | $4,096 | $263,600 | $87,400 | $176,200 |
| 2018 | $3,843 | $239,300 | $87,400 | $151,900 |
| 2017 | $3,624 | $225,100 | $87,400 | $137,700 |
| 2016 | $3,623 | $208,700 | $83,500 | $125,200 |
| 2015 | $3,291 | $181,300 | $83,500 | $97,800 |
| 2014 | $3,224 | $177,800 | $83,500 | $94,300 |
Source: Public Records
Map
Nearby Homes
Your Personal Tour Guide
Ask me questions while you tour the home.