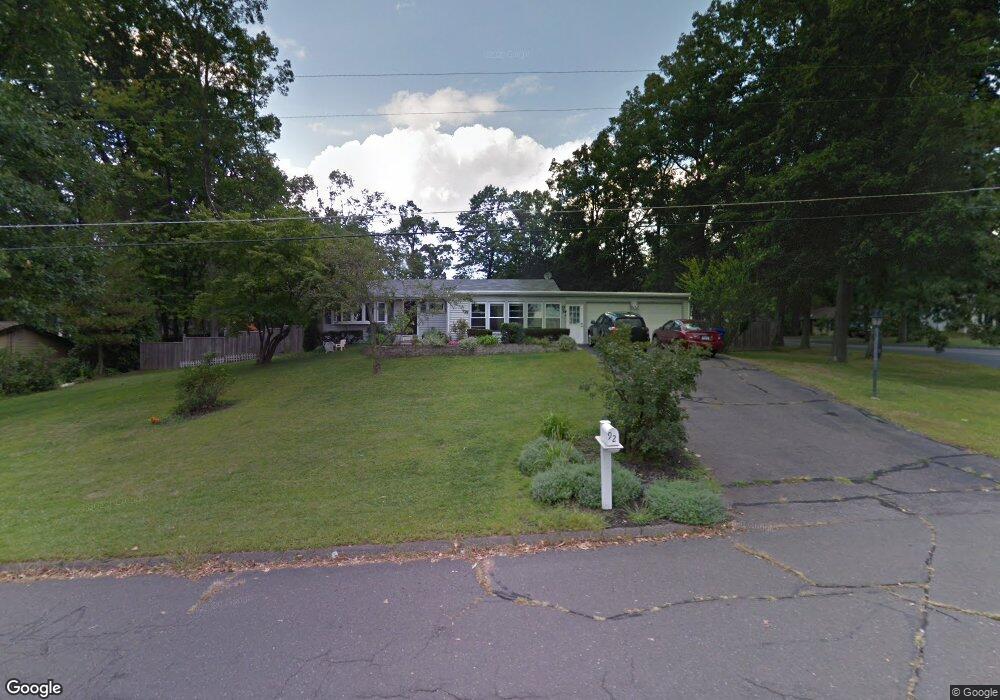
92 Brian Rd South Windsor, CT 06074
Estimated Value: $380,000 - $439,000
3
Beds
2
Baths
1,256
Sq Ft
$331/Sq Ft
Est. Value
About This Home
This home is located at 92 Brian Rd, South Windsor, CT 06074 and is currently estimated at $415,351, approximately $330 per square foot. 92 Brian Rd is a home located in Hartford County with nearby schools including Timothy Edwards School and South Windsor High School.
Ownership History
Date
Name
Owned For
Owner Type
Purchase Details
Closed on
Dec 21, 2021
Sold by
Larmand Jaime A
Bought by
Larmand Jaime A and Lewis Theresa C
Current Estimated Value
Purchase Details
Closed on
Sep 27, 2016
Sold by
Larmand Theresa
Bought by
Larmand Jaime A
Purchase Details
Closed on
Jul 1, 2011
Sold by
Larmand Jaime A
Bought by
Larmand Jaime A and Larmand Theresa
Purchase Details
Closed on
Apr 13, 2010
Sold by
Peubla Amy and Perry Bevin
Bought by
Larmand Jaime
Home Financials for this Owner
Home Financials are based on the most recent Mortgage that was taken out on this home.
Original Mortgage
$231,000
Interest Rate
5.12%
Purchase Details
Closed on
Feb 6, 1998
Sold by
Wesolowski Patricia
Bought by
Puebla Amy
Purchase Details
Closed on
Sep 1, 1992
Sold by
Miller Jeffrey
Bought by
Wesolowski Patricia
Create a Home Valuation Report for This Property
The Home Valuation Report is an in-depth analysis detailing your home's value as well as a comparison with similar homes in the area
Home Values in the Area
Average Home Value in this Area
Purchase History
| Date | Buyer | Sale Price | Title Company |
|---|---|---|---|
| Larmand Jaime A | -- | None Available | |
| Larmand Jaime A | -- | -- | |
| Larmand Jaime A | -- | -- | |
| Larmand Jaime | $231,000 | -- | |
| Puebla Amy | $115,000 | -- | |
| Wesolowski Patricia | $123,000 | -- |
Source: Public Records
Mortgage History
| Date | Status | Borrower | Loan Amount |
|---|---|---|---|
| Previous Owner | Wesolowski Patricia | $231,000 | |
| Previous Owner | Wesolowski Patricia | $13,200 | |
| Previous Owner | Wesolowski Patricia | $51,900 |
Source: Public Records
Tax History Compared to Growth
Tax History
| Year | Tax Paid | Tax Assessment Tax Assessment Total Assessment is a certain percentage of the fair market value that is determined by local assessors to be the total taxable value of land and additions on the property. | Land | Improvement |
|---|---|---|---|---|
| 2025 | $7,229 | $203,000 | $92,200 | $110,800 |
| 2024 | $6,995 | $203,000 | $92,200 | $110,800 |
| 2023 | $6,727 | $203,000 | $92,200 | $110,800 |
| 2022 | $5,529 | $142,600 | $85,200 | $57,400 |
| 2021 | $5,399 | $142,600 | $85,200 | $57,400 |
| 2020 | $5,402 | $142,600 | $85,200 | $57,400 |
| 2019 | $5,490 | $142,600 | $85,200 | $57,400 |
| 2018 | $5,372 | $142,600 | $85,200 | $57,400 |
| 2017 | $5,484 | $144,000 | $85,200 | $58,800 |
| 2016 | $5,377 | $144,000 | $85,200 | $58,800 |
| 2015 | $5,262 | $144,000 | $85,200 | $58,800 |
| 2014 | $5,113 | $144,000 | $85,200 | $58,800 |
Source: Public Records
Map
Nearby Homes
- 325 Kelly Rd
- 107 Main St
- 34 Benedict Dr
- 128 Pond Ln
- 441 Millstream Dr Unit 441
- 5 Allison Rd
- 33 Sunset Terrace
- 413 Lady Bug Ln Unit 413
- 169 Avery St
- 68 Kent Ln
- 178 Beelzebub Rd
- 156 Avery St
- 242 Talcottville Rd Unit 105
- 387 Foster St
- 25 Oakview Place
- 142 Marjorie Ln Unit 142
- 229 Phoenix St
- 39 W Vernon St
- 411 Slater St
- 455 Oakland Rd