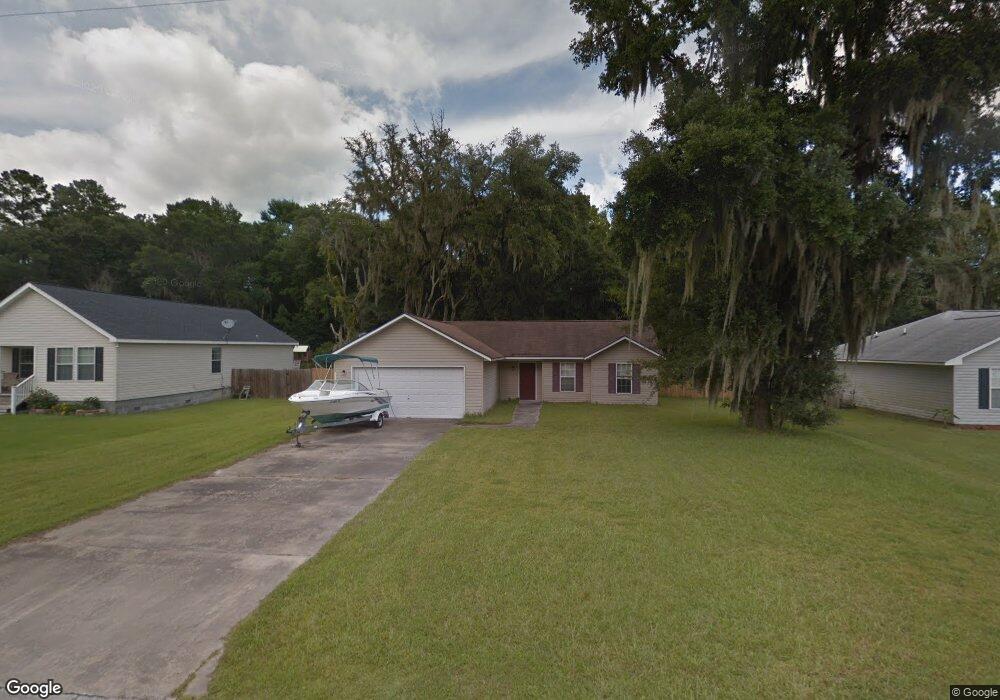
92 Calico Ct Midway, GA 31320
Estimated Value: $231,599 - $259,000
3
Beds
2
Baths
1,216
Sq Ft
$200/Sq Ft
Est. Value
About This Home
This home is located at 92 Calico Ct, Midway, GA 31320 and is currently estimated at $242,900, approximately $199 per square foot. 92 Calico Ct is a home located in Liberty County with nearby schools including Liberty Elementary School, Midway Middle School, and Liberty County High School.
Ownership History
Date
Name
Owned For
Owner Type
Purchase Details
Closed on
Jun 22, 2007
Sold by
Youschak Shawn M
Bought by
Burgess Larry G and Burgess Ginger P
Current Estimated Value
Home Financials for this Owner
Home Financials are based on the most recent Mortgage that was taken out on this home.
Original Mortgage
$129,000
Outstanding Balance
$79,616
Interest Rate
6.35%
Mortgage Type
New Conventional
Estimated Equity
$163,284
Purchase Details
Closed on
Apr 29, 2004
Sold by
Youschak Shawn and Youschak Shonda
Bought by
Youschak Shawn
Purchase Details
Closed on
Jul 31, 2002
Sold by
Youschak Shawn
Bought by
Youschak Shawn and Youschak Shonda L
Purchase Details
Closed on
Jun 12, 2002
Sold by
Charles W Smith
Bought by
Monogram Construction Inc
Purchase Details
Closed on
Sep 1, 2001
Sold by
Lanyard Development
Bought by
Charles W Smith
Purchase Details
Closed on
Nov 24, 1998
Bought by
Lanyard Development
Purchase Details
Closed on
May 9, 1996
Bought by
Lee Robert W
Create a Home Valuation Report for This Property
The Home Valuation Report is an in-depth analysis detailing your home's value as well as a comparison with similar homes in the area
Purchase History
| Date | Buyer | Sale Price | Title Company |
|---|---|---|---|
| Burgess Larry G | $129,000 | -- | |
| Youschak Shawn | -- | -- | |
| Youschak Shawn | -- | -- | |
| Youschak Shawn | $83,000 | -- | |
| Monogram Construction Inc | $17,000 | -- | |
| Charles W Smith | $8,500 | -- | |
| Lanyard Development | $8,200 | -- | |
| Lee Robert W | -- | -- |
Source: Public Records
Mortgage History
| Date | Status | Borrower | Loan Amount |
|---|---|---|---|
| Open | Burgess Larry G | $129,000 |
Source: Public Records
Tax History
| Year | Tax Paid | Tax Assessment Tax Assessment Total Assessment is a certain percentage of the fair market value that is determined by local assessors to be the total taxable value of land and additions on the property. | Land | Improvement |
|---|---|---|---|---|
| 2024 | $3,592 | $66,150 | $9,600 | $56,550 |
| 2023 | $2,907 | $59,633 | $9,600 | $50,033 |
| 2022 | $2,089 | $49,747 | $9,600 | $40,147 |
| 2021 | $1,911 | $45,304 | $9,600 | $35,704 |
| 2020 | $1,798 | $42,440 | $9,600 | $32,840 |
| 2019 | $1,770 | $42,822 | $9,600 | $33,222 |
| 2018 | $1,764 | $43,203 | $9,600 | $33,603 |
| 2017 | $1,435 | $43,585 | $9,600 | $33,985 |
| 2016 | $1,679 | $43,967 | $9,600 | $34,367 |
| 2015 | $1,761 | $43,967 | $9,600 | $34,367 |
| 2014 | $1,761 | $45,844 | $9,600 | $36,244 |
| 2013 | -- | $47,658 | $9,600 | $38,058 |
Source: Public Records
Map
Nearby Homes
- 163 Calico Ct
- 288 Isle of Wight Rd
- 32 Alder Pass
- 119 Jane St
- 580 Old Gress Island Rd
- 165 Holland Dr
- 405 Buckingham Dr
- 175 Old Sikes Rd
- 12085 E Oglethorpe Hwy
- 177 Carriage Way
- 151 Cottage Loop
- 338 Cottage Loop
- 244 Cottage Loop
- 280 Cottage Loop
- 45 Veranda Trail
- 23 Veranda Trail
- 85 Otto Dr
- 42 Winoca Dr
- 141 Colonial Dr
- 0 Colonial Dr
Your Personal Tour Guide
Ask me questions while you tour the home.