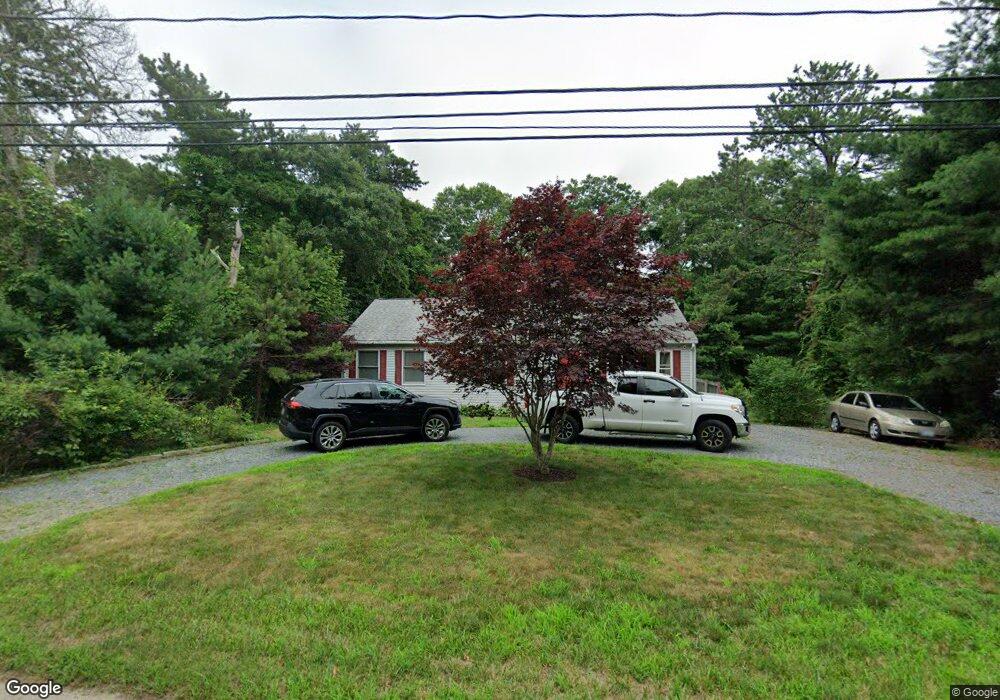
92 Clay Pond Rd Buzzards Bay, MA 02532
Monument Beach NeighborhoodEstimated Value: $502,969 - $562,000
3
Beds
2
Baths
1,196
Sq Ft
$443/Sq Ft
Est. Value
About This Home
This home is located at 92 Clay Pond Rd, Buzzards Bay, MA 02532 and is currently estimated at $530,242, approximately $443 per square foot. 92 Clay Pond Rd is a home located in Barnstable County with nearby schools including Bourne High School, Cadence Academy Preschool - Bourne, and St Margaret Regional School.
Ownership History
Date
Name
Owned For
Owner Type
Purchase Details
Closed on
Nov 14, 2022
Sold by
Frotten Ft and Costa
Bought by
Epps Joseph R and Finton Rhiannon R
Current Estimated Value
Home Financials for this Owner
Home Financials are based on the most recent Mortgage that was taken out on this home.
Original Mortgage
$405,982
Outstanding Balance
$393,860
Interest Rate
7.5%
Mortgage Type
FHA
Estimated Equity
$136,382
Purchase Details
Closed on
Aug 24, 2022
Sold by
Frotten Allen J
Bought by
Frotten Ft and Frotten
Purchase Details
Closed on
Aug 16, 1995
Sold by
Hollytree Rt and Spence Michael J
Bought by
Frotten Allen J and Frotten Jean M
Purchase Details
Closed on
Jun 22, 1994
Sold by
Gouger David M and Gouger Beverly W
Bought by
Hollytree Rt and Spence Michael J
Create a Home Valuation Report for This Property
The Home Valuation Report is an in-depth analysis detailing your home's value as well as a comparison with similar homes in the area
Home Values in the Area
Average Home Value in this Area
Purchase History
| Date | Buyer | Sale Price | Title Company |
|---|---|---|---|
| Epps Joseph R | $420,000 | None Available | |
| Epps Joseph R | $420,000 | None Available | |
| Frotten Ft | -- | None Available | |
| Frotten Ft | -- | None Available | |
| Frotten Allen J | $115,000 | -- | |
| Frotten Allen J | $115,000 | -- | |
| Hollytree Rt | $25,000 | -- | |
| Hollytree Rt | $25,000 | -- |
Source: Public Records
Mortgage History
| Date | Status | Borrower | Loan Amount |
|---|---|---|---|
| Open | Epps Joseph R | $405,982 | |
| Closed | Epps Joseph R | $405,982 |
Source: Public Records
Tax History
| Year | Tax Paid | Tax Assessment Tax Assessment Total Assessment is a certain percentage of the fair market value that is determined by local assessors to be the total taxable value of land and additions on the property. | Land | Improvement |
|---|---|---|---|---|
| 2025 | $3,274 | $419,200 | $181,900 | $237,300 |
| 2024 | $3,201 | $399,100 | $173,200 | $225,900 |
| 2023 | $3,157 | $358,300 | $153,300 | $205,000 |
| 2022 | $3,031 | $300,400 | $135,700 | $164,700 |
| 2021 | $2,965 | $275,300 | $123,500 | $151,800 |
| 2020 | $2,865 | $266,800 | $122,300 | $144,500 |
| 2019 | $2,736 | $260,300 | $122,300 | $138,000 |
| 2018 | $2,557 | $242,600 | $116,500 | $126,100 |
| 2017 | $2,430 | $235,900 | $109,600 | $126,300 |
| 2016 | $2,350 | $231,300 | $109,600 | $121,700 |
| 2015 | $2,213 | $219,800 | $98,100 | $121,700 |
Source: Public Records
Map
Nearby Homes
- 20 Colony Ave
- 5 Harbor Hill Dr
- 4 Harbor Hill Dr
- 16 Amberwood Ct
- 203 County Rd
- 566 Shore Rd
- 12 Turnberry Rd Unit 12
- 2 Applewood Ct
- 4 Hollyhock Knoll Ct Unit 4
- 4 Hollyhock Knoll Ct Unit 4
- 13 Laurel Hill Ct
- 5 Sea Knoll Ct
- 5 Zoli Ln
- 3 1st St
- 709 County Rd
- 14 Navajo Rd
- 3 4th Ave
- 7 4th Ave
- 254 Barlows Landing Rd
- 44 Cotuit Rd
Your Personal Tour Guide
Ask me questions while you tour the home.